Data-Driven Attribution Vs Other Attribution Models - Which Attribution Model Is The Best?

Lukas Piątek, Oskar Maciejek
Data analysis
Dec 9, 2019

 
Attribution (Latin attributio) - a term with many meanings. Most often, attribution is used in the context of ascribing something to someone/something else. It also means inference, explaining someone's behaviour. In psychology, attribution is defined as people recognising attitudes, phenomena and situations around them. In the latter sense, the concept of attribution was introduced in 1958 by Fritz Heider (1896–1988), an American psychologist of Austrian origin.
 
In marketing, attribution, allows us to assign an appropriate value to selected metrics. In online marketing, metrics apply to all sorts of data collected, e.g. by an online store during customer visits, as well as to the sources of visits to the page. It is possible to identify direct traffic, e.g. when the customer enters the domain name directly in the browser, organic traffic coming from the search engine, traffic from social media, traffic from links e.g. when the customer simultaneously visits both a specific website and clicks links on other pages and paid traffic e.g. during Google Ads advertising campaigns.
 
Metrics are therefore a tool to increase website traffic. However, for these actions to bring real benefits, the data must be carefully analysed and appropriate action must be taken to increase sales.
 
The interest in attribution in marketing activities is increasing every year. This is evidenced by numerous presentations or blog entries. In this article, we will discuss the most popular attribution models in the context of their capabilities and the Google Analytics tool.
 
Attribution models make up a rule or a set of rules that determine how sales and conversions are attributed i.e. the actions of the recipient—potential customer in response to a dedicated advertising campaign posted on the web or initiatives attributed to SEO, and to clicks, i.e. touchpoints.
 
Popular attribution models include: the last and first-click models, the linear model, the time decay model, and the position-based model. In the era of the development of technology and the growing popularity of increasingly complex customer journeys, more advanced data-driven models have appeared, e.g. Data-Driven Google Ads, DoubleClick Search, Google Analytics Premium (Shapley value model). Currently, the Markov model which has interdisciplinary applications has also become a very well-known complex model.
 

LAST-CLICK ATTRIBUTION MODEL

Img

Our observations show that the most popular model is the last-click attribution model, which assigns a value (revenue, acquired contacts) to the user's last interaction (campaign, source/medium). The reason for the popularity of this model may be its uncomplicated nature because it is the simplest tool to understand and measure.
 
Advantages of the last-click attribution model
Up to a certain stage of business development, this model seems to be sufficient. The positive features of the last-click attribution model are: result orientation, simple principles of operation and availability of measurement tools (e.g. Google Analytics).
 
Disadvantages of the last-click attribution model
The last-click attribution model may not be fully authoritative for developing companies that use many opportunities to bring traffic to their online ecosystem. This model does not reflect the possible intermingling of channels, and thus hinders the analysis, as well as the process of assigning value to each of the actions. As a consequence, this situation may hinder reaching a higher level of business results. It is important to realise that the last-click attribution model is heavily based on post-click results and cost optimisation. Therefore, in a growing company, solely relying on this method of rules determining the attribution of sales and conversions may turn out to be reckless and short-sighted.
 

FIRST-CLICK ATTRIBUTION MODEL

Img

 
The first-click attribution model assigns 100 percent of the value to the channel (e.g., traffic source) that first occurred on the path to generating value (revenue, conversion), bypassing the last interaction (last-click), as well as the interaction between the start of the user's journey and the last interaction.
 
Advantages of the first-click attribution model
The first-click attribution model may be beneficial when looking for marketing channels that are more valuable in terms of acquisition (project scaling, searching for new customers).
 
Disadvantages of the first-click attribution model
The first-click attribution model does not take into account the further user journey and the most popular last-click model, i.e. the channels at the end of the sales process. Therefore, marketing specialists may have a problem justifying the results based solely on first-click attribution.
 

LINEAR ATTRIBUTION MODEL

Img

 
The linear attribution model is characterised by the fact that each touchpoint on the conversion path has the same share in the sale.
 
Advantages of the linear attribution model
The undoubted benefit of the linear attribution model is the optimisation of advertising budgets along the entire customer journey, and not just at one touchpoint. This attribution model allocates the same proportion of conversion value to all funnels the customer came in contact with before the purchase.
 
Disadvantages of the linear attribution model
Because the linear attribution model assigns the same proportion of conversion values to all channels, there is a risk that both valuable and insignificant channels are treated the same way. This situation may lead to falsified analysis and underestimating the most important touchpoints.
 

POSITION-BASED ATTRIBUTION MODEL

Img

 
The position-based attribution model takes into account the entire conversion path, assigning the largest contribution for its creation to the user's first and last traffic source.
 
Advantages of the position-based attribution model
The undoubted benefit of this model is the appreciation of the first and last touchpoints and not just one touchpoint. This is especially helpful in promotional activities that use remarketing. This is because the first touchpoint with a potential customer will provide information on where to look for new users. In turn, the last touchpoint informs us on where to increase the visibility of a given advertisement to translate the acquisition into success.
 
Disadvantage of the position-based attribution model
The first and last interaction are evaluated equally. Not every channel can finalise the sale and initiate it to the same extent.
 

TIME DECAY ATTRIBUTION MODEL

Img

 
The time decay attribution model assigns the highest value to the nearest conversion point. The further the touch point is, the lower its value (in line with the distance from the point of conversion). Subsequent points are assigned smaller values according to the distance from the conversion. The time decay model can be used in advertising campaigns based on various promotion channels.
 
Advantages of the time decay attribution model
This model can be an alternative to the last-click attribution model because it includes the entire path and also assigns a high value to the last-click. The advantages of the model include its result orientation and simple operating principles, similar to the last-click model.
 
Disadvantages of the time decay attribution model
The risk resulting from the time decay attribution model is the marginalisation of the value of touchpoints initiating the path. This must be taken into account when scaling business and analyse the sales initiation channels.
 

PROJECT MANAGEMENT, MILESTONES

It is worth noting that milestones allow for coordinating and controlling the project.
In the context of attribution, there are two key stages, i.e. milestones. Achieving them involves answering the following questions:
How can technological and tool restrictions be overcome?
Which attribution model should be chosen? Which attribution model is the best and most effective?
 

ATTRIBUTION AVAILABLE IN THE GOOGLE ANALYTICS TOOL

Google Analytics Conversion Report—the most important conversion paths.

Img

 
This graphical report presents the user journeys leading to the purchase. This gives you the ability to determine which channels most often increased sales. These channels are: organic traffic, direct traffic and paid traffic from search engines. It should be noted that due to the pictorial nature of the above statement, we will not find in it a grouping of paths and values (e.g. in the form of revenue for a group of paths).
 

VALUE OF INCOME FOR A PATH AND ATTRIBUTION - GOOGLE ANALYTICS CONVERSION REPORT - COMPARISON OF ATTRIBUTION MODELS


LAST-CLICK ATTRIBUTION MODEL

Img

 
FIRST-CLICK ATTRIBUTION MODEL

Img

 
In the popular tool, it is possible to compare some of the attribution models (last-click attribution model, first-click attribution model, linear attribution model, time decay attribution model, position-based attribution model). This situation is proof that attribution data does not require high financial expenditures, both in terms of technology and the use of dedicated tools.
 

WHICH ATTRIBUTION MODEL IS THE BEST IN THE CONTEXT OF THE ENTIRE PATH?

It is worth noting that there are many attribution models. Therefore, deciding which of them is the best is a challenge. However, the answer to this question is simple. **No model is optimal and the best results are achieved by comparing attribution models with each other. **
This issue will be discussed in the example below, in which we will compare free direct traffic and paid search engine traffic.

Img

 
In first-click attribution, the direct traffic channel generated over 378,000 fewer entries than in last-click attribution. This may mean that the direct traffic channel is successfully completing the sales process, but other channels had some involvement. In contrast, the paid search engine traffic channel was more important in terms of generating demand. It is an activity that supports the acquisition because in the first-click attribution, it generates 109,000 more entries than in the case of the last-click attribution.
 
The Google Analytics module allows for collecting very valuable data partially solving both milestones (i.e. access to the attribution tool), as well as the problem of choosing the attribution model. However,
it should be understood that the free version of Google Analytics has several disadvantages. They include:

  • An inconvenient form for data comparison—to present the above comparison, it is necessary to transfer data into a spreadsheet and make a calculation.
  • No complex attribution models: data-driven model, Markov model and Shapley value model.
  • Impossible to use attribution on data outside the network (data from a CRM, business data). The Google Analytics Premium version, which was described in the report presented above, provides an additional attribute method that refers to the Shapley value model; however, bear in mind that the tool version is paid, and thus the barrier to entry becomes quite high because of the cost. The tool is made available from selected resellers who also offer onboarding for an employee to prepare them for new duties in such a way that they are able to effectively use Analytics Premium (streaming) as soon as possible.
     

FUNNEL-BASED ATTRIBUTION WITH REGARD TO ENHANCED E-COMMERCE (OR IMPROVED E-COMMERCE VERSION) AND OTHER EVENTS (FUNNEL-BASED ATTRIBUTION MODEL)

In traditional attribution models, we focus on the following two topics:

  • Conversion (analysed in this text);
  • The order of the traffic sources of users coming to a given website before converting.

It is worth noting that none of these attribution models takes into account the interaction of a potential customer with a given website using traffic sources in such a way as to assess their quality and contribution to the implementation of a given transaction.
Analysis of the following diagram will show that each traffic source plays a different role in the user's journey.


Img


  • Source A (awareness stage)—starts the user's journey with the website, but in no way leads to purchase because the customer leaves the website almost immediately. The role of the source that generated the exit from the site is only to build user awareness about the existence of a given company or product.
  • Source B (reflection stage)—located in the middle of the funnel, arousing the user's interest in a given company or product as a result of browsing the catalogue of offers/articles.
  • Source C (decision/conversion stage)—located at the end of the user's journey, associated with adding the product to the cart as well as making the purchase.
     
    Therefore, the question arises: Is the information about the order in which individual sources of user/customer traffic appear sufficient information to assign the right value to the conversion?
     
    The solution for those who consider that each traffic source ought to be assigned an individual
    conversion value depending on the actions that the user made is the funnel-based attribution model. This model takes into account more information than what results from customers' visits and conversions. Funnel-based attribution takes into account specific actions that a user performs when passing through the entire shopping funnel.
     
    An example of a shopping funnel in an online store is as follows:
  • A user/customer enters the website;
  • The user becomes familiar with product categories on a given website or uses a search engine for this purpose;
  • The user visits the page of a specific product;
  • The user adds a product to the cart;
  • The user/customer makes a purchase

 
Based on the above purchase funnel, the following steps are implemented:

  • Individual steps/actions that users took in the shopping funnel are assigned weights, i.e. a scoring system. If the given source/medium was the first in the funnel to lead to a given event, then it is assigned the appropriate conversion value based on a previously established scoring system.
  • Revenues are attributed according to assigned weights, i.e. the scoring system of individual events, and added to traffic sources or other dimensions.
     
    What are the necessary elements required to use this attribution model?
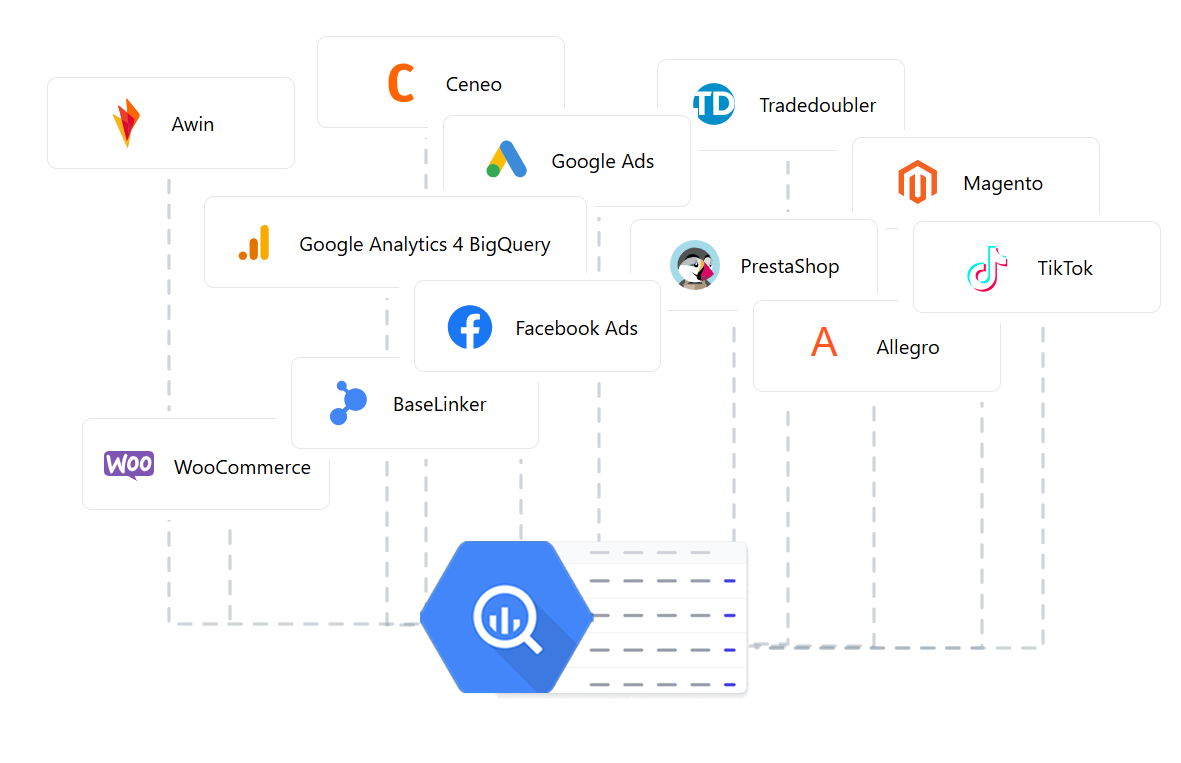
    Data Warehouse database software)—own data set located in one ecosystem e.g. Google Cloud Big Query or Google Analytics Premium database. Because each user/customer goes through their own shopping funnel, the data analysis process is extremely complex and varied, and above all, individual and dependent on the nature of the project, hence the need to create a database that allows for easy data migration and for performing operations on the database that match our needs.
     
    What else is worth including in this attribution model?
     
  1. Custom goals – having a database allows you to write advanced SQL queries, and thus facilitates the
    creation of an unlimited number of custom goals and segments created by users. Example goals are provided below:
  • Purpose of the attribution model: engaged users staying on the website at a certain time who generate a certain number of events.

Img

  • Purpose of the attribution model: users browsing products that cost over PLN 1,000 on the website

Img

It is worth realising how important it is to create an integrated attribution model combining online and offline data, which would be a bridge between marketing activities and offline purchases with data on the Internet.

  1. Online data – considering integrating your database with the data available online, and marketing expenses in various systems. Google Analytics files only provide information about the costs of Google Ads. Therefore, the challenge for analysts is the integration of costs from affiliate systems, financial expenses for advertising placed on Facebook, as well as the costs of website positioning and many others.
  2. Offline data – the last important element for attribution analysis is offline data, i.e. business data processed after the transaction on the website,
    e.g .: returns of products in the online store, order status from the system for customers who leave an email for contact, status after talking to a consultant on the hotline.

RESULTS

The following is an analysis of the results of the practical application of the funnel-based attribution model on the example of an online store.
 

Img


The data presented in the table contains Google Analytics implementation and configuration errors. The quick payment domain (https://platnosci.bm.pl/), which is marked in the funnel as a new source of traffic, making us lose track of the true source, has also not been excluded from the data. It is worth looking at how individual attribution models deal with such an error.
 
Attribution and its models, which, based on data from traffic analysis on a given website, logically assign transactions to the appropriate sources (in this case they tell us that the source/medium did not start generating revenue) and thus comes to the rescue. The emphasis here is that the basic models in Google Analytics are available in the free version. However, for a better illustration and comparison of the phenomenon, the first-click attribution model that best handled the error detection was taken into account. This is justified because traffic is lost along the way and a new source/medium is created.
 

MARKOV ATTRIBUTION MODEL

This model detected the problem, but the channel was marginalised to a small extent. The Markov model shows over 20 per cent less revenue. Therefore, the analysis of this model shows that it is not the right tool to detect the anomaly described above.
 

FUNNEL-BASED ATTRIBUTION MODEL

The model detected the problem of incorrect implementation and marginalised the channel, assigning it a minimum revenue value. Based on the analysis of the purchase funnel and the granular events occurring in it, it appears that this model is perfectly capable of detecting anomalies in the data. It turns out that no previous event was related to a given traffic source. Thus, it confirms the anomaly and an error in the data, because in practice such a situation occurs extremely rarely.
 

What tools were used to respond to challenges and milestones?
Data integration, database delivery, user journey, custom goals and events, and the attribution model itself were developed using the WitCloud tool that allows for data integration in the Google Cloud system and provides an automated attribution system based on BigQuery. The WitCloud tool is intended for entities and people who do not have programming resources written in R or who do not have the appropriate database.


Rate article

Rates: 0 Avarage rate: 0