
Advertising keeps getting more expensive. The same budget that brought in customers a year ago brings in fewer today, and each additional one costs more than the last. There are two natural reflexes, and both fail. You can pour more into the budget — but auctions get more crowded, so doubling spend doesn't double sales. You can pull back and focus on existing customers — but then the base stops growing, and the same problem returns in a few months, just with fewer customers. The way out is somewhere most stores don't look: what happens to a customer after their first purchase. That's the knowledge that tells you how much a new customer is actually worth — and therefore how much you can afford to pay to acquire one, so acquisition adds up again.
We show how to analyze buyer behavior and turn that knowledge into actions that increase revenue from existing customers and make acquiring new ones worthwhile again.
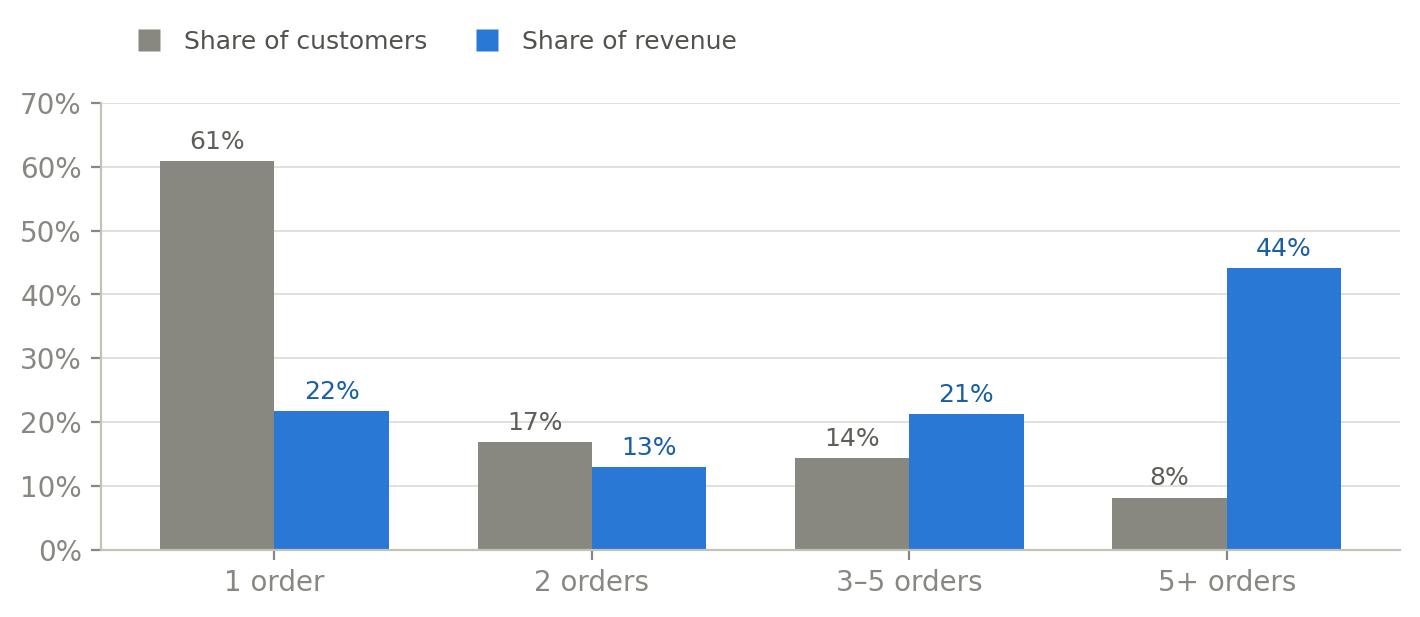
In the store we ran this analysis on, 61% of customers bought exactly once, and together they account for 22% of revenue. Meanwhile, the 8% of customers with five or more orders bring in 44% of revenue — almost half. Your proportions will differ, but the shape usually repeats: the largest group contributes the least, and the smallest group drives the result.
Two levers you have to pull together
Working with your customer base isn't about giving up on advertising. The effect only comes from combining two things:
- Retention. Precisely identify which customers need attention and how to help them buy more, more often.
- Acquisition. Combine customer behavior data with traffic and ad cost data. That tells you which customers are worth acquiring and which products to attract them with, so you build high LTV from day one.
Starting point: see the customer, not just the transaction
Most reports only answer one question: how much did we sell today? Working with the customer base requires deeper questions: who's actually buying from us, what happens to them after their first order, and how much are they worth to us over time?
To measure this, we build a customer lifecycle map from three signals: how recently the customer bought, how many times they've bought, and how much they're worth relative to their own average order value. That produces over a dozen precise segments, which group into five readable stages:
- New
- Returning
- Loyal (split into standard and highest-value)
- At risk of churning
- Lost / won back
The thresholds are yours, not ours. How many days without a purchase means a customer is at risk? How many means they're lost? What value makes a customer your most valuable one? In fashion, these lines look completely different than in supplements or cosmetics. You set them all around your actual purchase cycle — and that's the difference between segmentation that describes your business and segmentation that forces someone else's template onto it.
The two transitions that matter most
Customers are constantly moving between stages, but not every transition carries equal weight:
- From first to second purchase. A one-time purchase can be a fluke. Only the second turns a buyer into a customer. Customers who never came back are usually the largest and most underrated group in the base.
- From returning to loyal. This is where it gets decided whether a customer stays with you for years.
Every such move has a name and a size — from a customer promoted into your most valuable group, through a warning about rising churn risk, to a confirmed loss. Instead of asking whether you're losing customers, you see how many, from which segment, and in which direction.
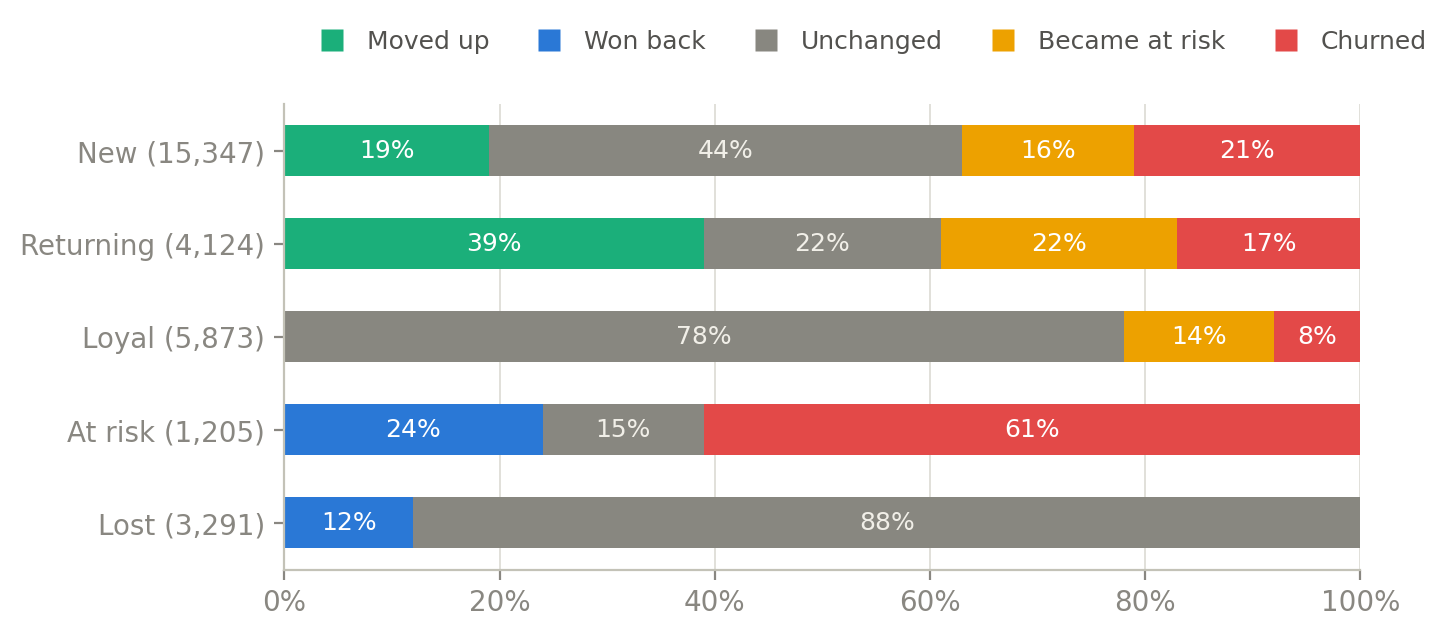
Look at the "New" row: 21% churned within one comparison period. That's just above the level our analysis flags as critical — which is exactly why the first transition deserves the most attention.
As you analyze these movements, you start noticing real business problems. If customers leave en masse after buying a pricier product, the reason might be poor packaging or a lack of post-purchase support. You form a hypothesis, change the customer experience, and check live whether the return rate improved.
STEP 1: work with the customer you already have
Once you know which customers to focus on, you translate that into automated actions in email and ads:
- A new customer who hasn't come back yet — usually the largest group in the base, and therefore the biggest lever. The question isn't whether to reach out, but when and with what. From the data, you know how many days it typically takes customers in your store to place a second order — you set the sequence to land before that moment, not disconnected from it.
- Returning — halfway to loyalty, and the best moment to check what separates those who kept going from those who stopped. The category of the second and third purchase usually says a lot.
- Loyal — your most valuable group, and at the same time the easiest one to burn budget on, paying for sales that would have happened anyway. Excluding loyal customers from broad reach campaigns is a test worth running, not a dogma. Ad platforms learn from conversions, so the effect varies by account. A less controversial use of the same list: material for lookalike audiences.
- At risk of churning — you react before they show up in a report as lost. What matters isn't just that a customer has been quiet for a few months, but how much they were worth.
It's worth pausing on the loyal-customer point, because it's counterintuitive. Among the channels that look most profitable in reports, part of the revenue comes from customers who would have bought anyway, without ads. Separating these two streams doesn't save anything by itself, but it shows you where it's even worth looking, and turns a discussion about cutting budget into a conversation about numbers.
Important: audience lists have to recalculate automatically. A static file uploaded to the ad manager stops telling the truth after two weeks — some people from the "at risk" list have already bought, and new ones have taken their place. It's also worth remembering platform realities: a segment under roughly 100 people usually won't form a working audience, and a lookalike audience needs a thousand or more.
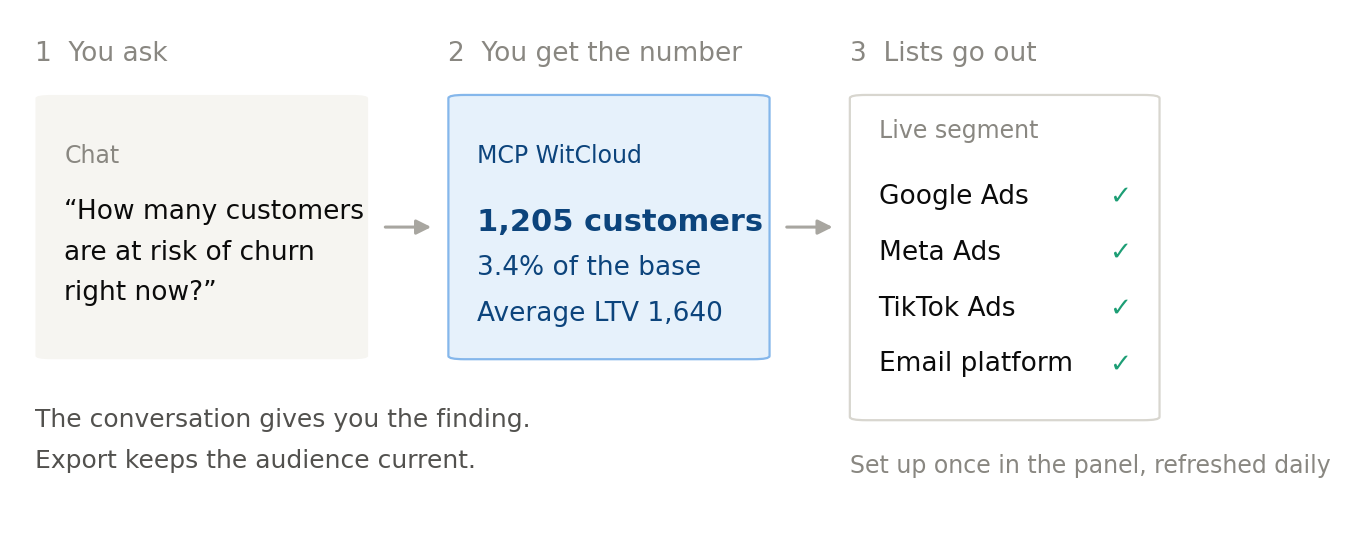
The division of labor here is clear: the conversation gives you the conclusion and the number, and the export module keeps the list current in the ad platforms. You configure the segment once, then it refreshes itself.
STEP 2: acquire better customers using data from your base
Once you combine customer value data with cost and traffic-source data, you stop burning budget on one-time deal hunters. You acquire people who will naturally move onto the repeat-purchase path after their first transaction.
Evaluation horizon: count the whole cycle, not the first purchase
Take every customer you acquired in a given month and check how much they've spent with you since then. Part of the revenue came from the first order, part from later ones — and that second part grows with every additional month.
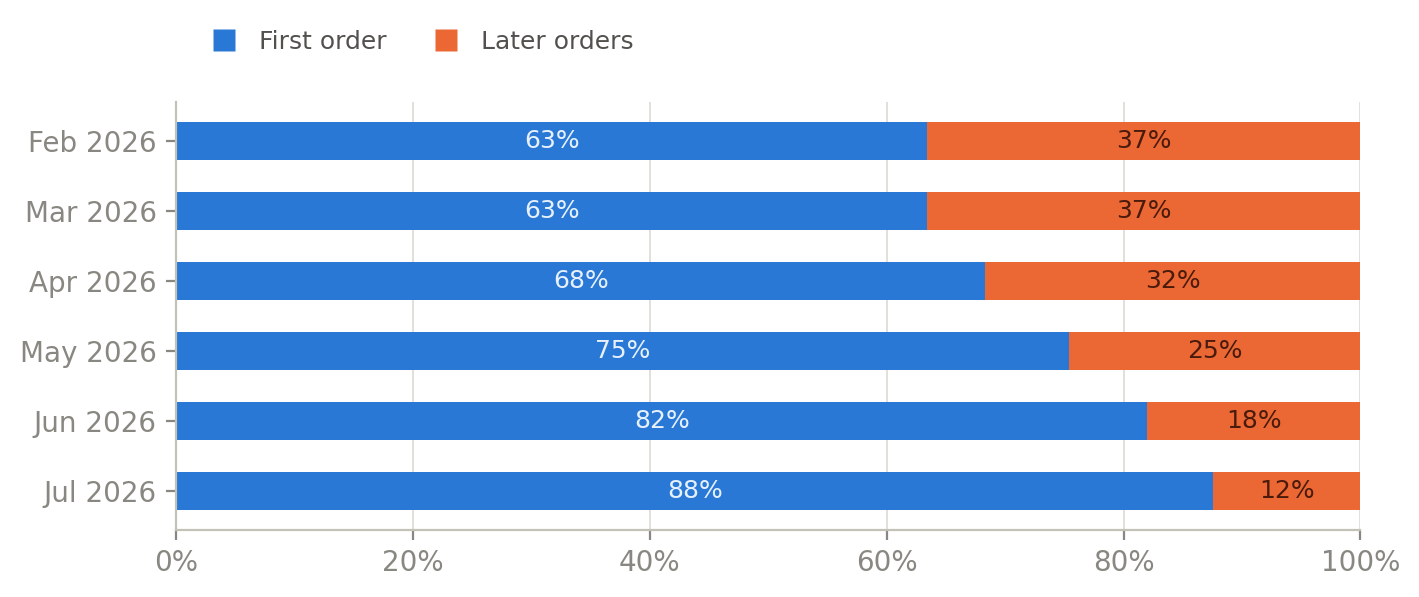
In cohorts acquired earlier, which had time to mature, about 35% of revenue shows up after the first order. The June and July cohorts show a lower share only because they're younger. The conclusion is simple: a campaign graded solely on the first purchase hides a third of its own result.
Assortment: products that attract the right people
A bestseller with a nice first-purchase ROAS is rarely the same product customers come back for. Looking at the base, you start distinguishing four completely different roles in the catalog:
- volume products — attract lots of customers who don't come back afterward,
- gateway products — attract fewer customers, but ones who stay with the brand longer,
- franchise products — near the top of both first and repeat orders; they acquire and retain,
- deep-loyalty products — only bought after many orders, the hallmark of your best customers.
Acquisition budgets are worth pumping into the second and third categories. The fourth is material for a loyalty program, not a reach campaign.
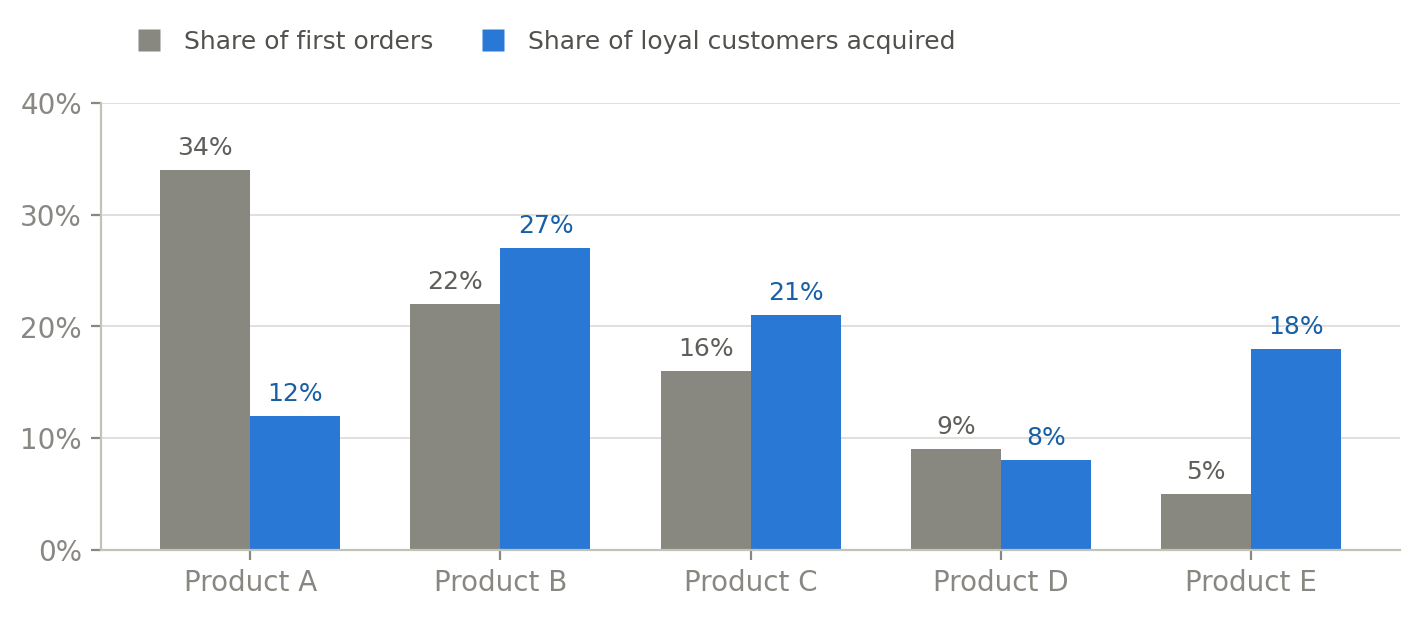
When the blue bar is taller than the gray one, the product attracts customers who stick around. Product A has the largest volume and the weakest profile; Product E is the opposite. Keep scale in mind, though — a product responsible for 5% of first orders might simply be too small to build a campaign on, even with the best loyalty profile.
Channels: it's not one question, it's two
This is where the most common mistake happens. "Which channel is effective?" is actually two different questions, and the answer to each can be completely different:
- Which channel acquires the best customers? What matters is acquisition cost and what share of acquired customers actually stayed loyal. A low-volume, high-quality channel tends to be systematically underfunded.
- Which channel generates current revenue? Here, a big part of the result is purchases from customers this channel never actually acquired — it just picked up their repeat order.
Mixing up these two questions leads to scaling a channel that's only harvesting what's already there, and cutting the one that actually brings people in. On top of that comes the attribution model question: a channel that looks weak under last-click often initiates purchase paths that other channels close out.
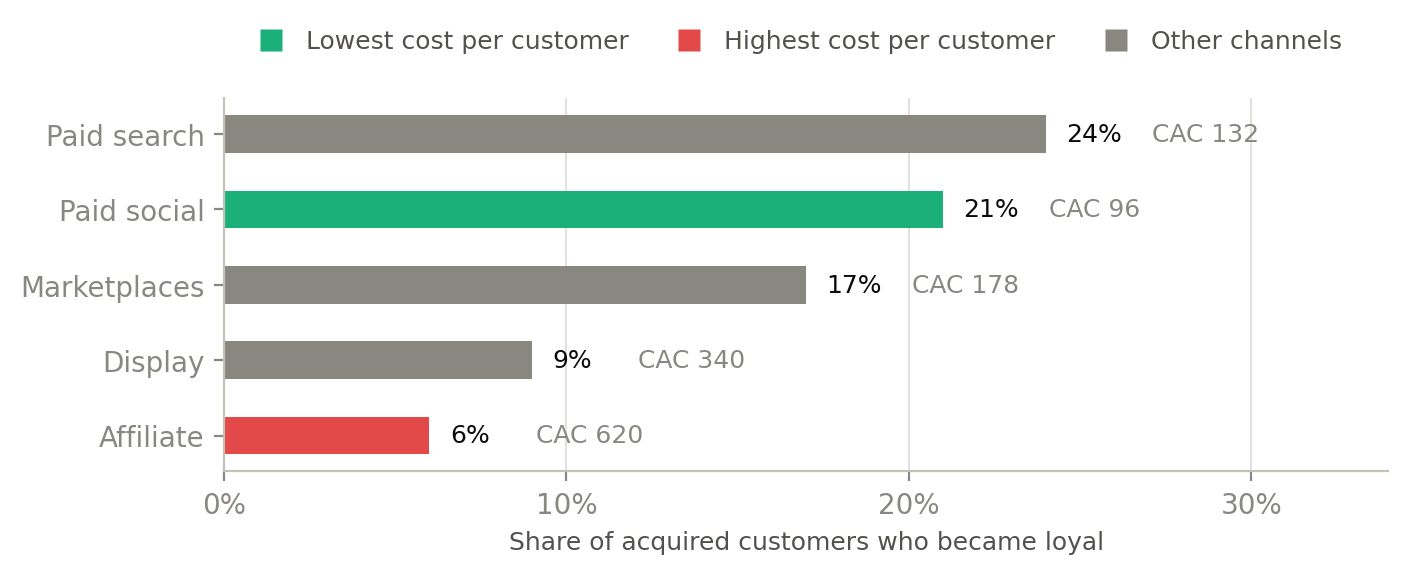
The cheapest channel is Paid social: $24 per new customer. The most expensive is Affiliate: $155 — over six times as much. But cost alone isn't enough to judge by. In Paid search, one in four acquired customers becomes loyal; in Affiliate, fewer than one in ten. So Affiliate is simultaneously the most expensive and the weakest on quality — the easiest candidate to cut from the acquisition budget.
A gap above 3x is the point where it's worth shifting budget. Free channels were left out — at zero cost, there's nowhere for them to land on this axis.
Discounts: check who you're actually buying
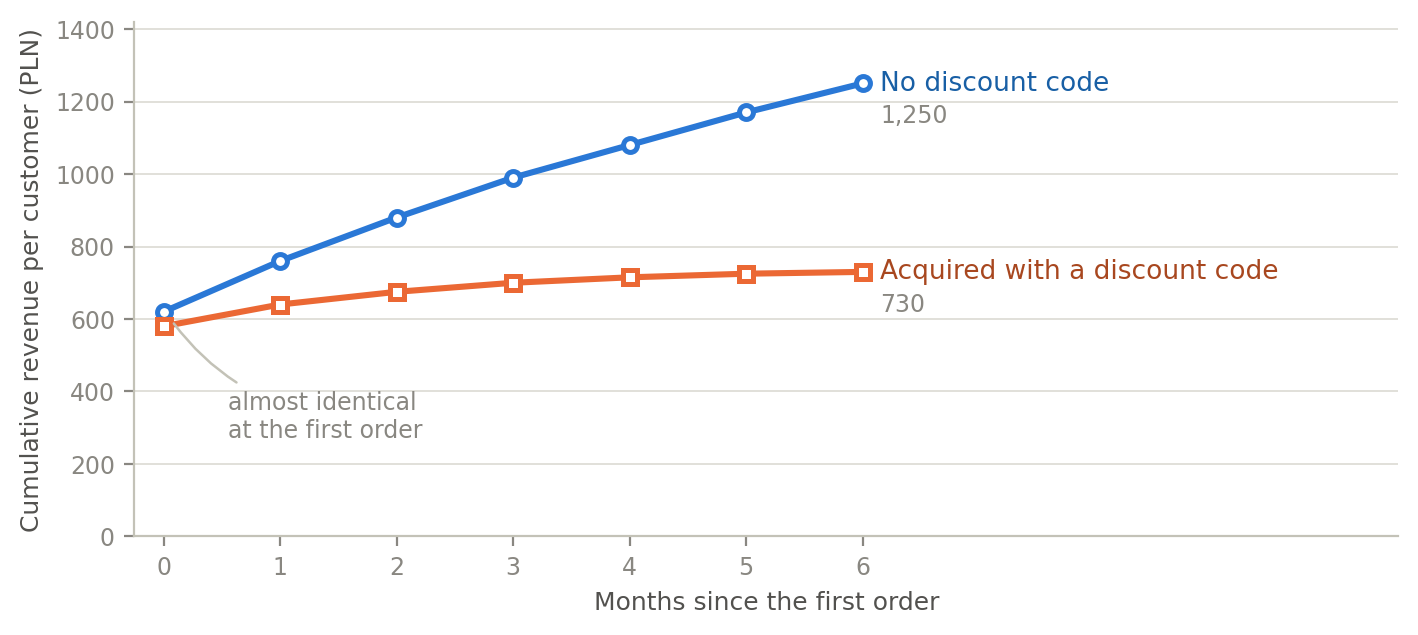
Cohorts of customers acquired with a discount code can be compared to cohorts acquired without one — not by their first order, but by how much they spent in the following months. It's the simplest way to check whether a promotion brings in customers or just speeds up sales you would have made anyway.
What this is built from
Everything above is a way of working, but someone has to keep it running. That's what WitCloud does: the platform we deploy on your data. Orders, customers, and ad costs flow into a single foundation, from which segments, flows between them, cohorts, and audience lists are all calculated. You don't have to build or wire any of it together yourself.
Three things run on this same foundation:
- Reports and analysis answer the question of what's happening and why. Live dashboards plus ready-made analyses for specific business questions: base structure, cohort quality, products, channels.
- List export answers the question of how to put it into action. Segments go out as live audience lists to Google Ads, Meta Ads, TikTok Ads, and email marketing systems.
- WitCloud MCP is the conversational layer on top of the data. You ask in plain language and get conclusions along with recommendations, without ordering a report from an analyst.
The key consequence: you define a segment once. The same "at-risk customer with high LTV" is identical in the report you look at, in the list uploaded to Meta, and in the answer you get in chat. There aren't three definitions of the same customer across three tools that stop matching each other after six months — which is the default state at most companies still running this on exports and spreadsheets.
How this differs from the report you might already have
Three things that actually make the difference in practice:
The analysis knows what the numbers mean. You don't get a table to interpret yourself. You get a conclusion: where value is concentrated, what share of the base is already inactive, which customer flow is a critical signal, and which one is within normal range.
MCP knows your business, not just your data. Before it calculates anything, it loads your company's context — industry, brand, market, seasonality. That's why its recommendations sound like they come from someone who understands what you sell, not like the output of a database query.
Conclusions end in action. List export is a full part of the system, not a file for manual upload. Segments recalculate automatically and land, in the same form, in Google Ads, Meta Ads, TikTok Ads, and email marketing systems.
The whole thing runs in your own Google Cloud — your data remains 100% your property.
This is a process, not a one-off project
A customer-base analysis done once has a short shelf life. The base is alive: customers move between stages every day, and the ones you flagged as at-risk a month ago have either already bought again or are lost by now. The value doesn't come from a single report — it comes from watching these movements regularly and reacting to them regularly.
Let's be clear about this: you're not buying a report subscription here. You're launching a new campaign line that serves your existing customers, alongside the one that acquires new ones. The work splits into three layers, and only the first happens without your involvement.
- Data and lists — the system does it
Store orders, ad platform costs, and GA4 traffic data flow in daily and join up on their own. With every refresh, segments recalculate from scratch: a customer who just placed a second order moves from "new" to "returning" without anyone lifting a finger, and one who crossed your inactivity threshold falls into "at risk" on their own.
The same applies to audience lists. A segment connected once to Google Ads, Meta Ads, TikTok, or an email system syncs daily — whoever bought drops off the at-risk list before the next send, and whoever stopped buying takes their place. There are no CSV exports, no manual file uploads, and no watching for when a list has gone stale.
You set it up once: inactivity thresholds, the value threshold for your best customers, and mapping your store to its data sources. After that, you don't have to maintain or watch over it.
- Campaigns — the marketing team does it
A segment doesn't sell anything by itself. Someone has to build a campaign on top of it — on both sides: paid ads and email.
- In Google Ads, Meta Ads, and TikTok Ads: remarketing campaigns to at-risk and lost customers, with a higher bid for those with the highest LTV; excluding loyal customers from reach campaigns so you don't pay for sales that would happen anyway; lookalike audiences built on your best customers; shifting budget toward products that attract repeat customers rather than just the bestseller. You can also add your most-loyal-customer segment as a signal in, for example, Google PMax campaigns, so your most critical campaigns get fed data about your best customers.
- In email and CRM: activation toward a second purchase for new customers who haven't come back, messaging for at-risk customers, and separate communication for loyal and win-back customers.
On top of that, creative — a different message reaches someone who bought once and vanished than the one meant to keep a customer around for their fifth order. This is real work, and it's heaviest at the start: the first few weeks go into setting up campaigns and lists in the ad platforms and preparing creative and messaging by segment. After that come adjustments and tests, not building from scratch.
It's worth planning this like the launch of a new campaign type, because that's exactly what it is. You don't need a new department or a full-time analyst, but you do need clearly assigned ownership: these campaigns have to be someone's actual scope, not a side task done in passing — because otherwise, after two months, all that's left are lists with no messaging behind them. Who that is depends on how your marketing is set up: your own team, or the agency that already runs your campaigns.
We don't take on the execution itself: your team or agency handles the messaging and creative. Our part is everything before and after that: which segments are worth reaching, in what order, at which point in the purchase cycle, with what intent — and afterward, whether the result came out the way you expected.
- Decisions — they're yours
Which products to promote upfront, whether a discount attracts customers or just speeds up sales that would have happened anyway, what offer to give at-risk customers, how to split budget across channels. These are business decisions, not calculations. The system is meant to prepare them for you, not make them for you.
MCP takes you as far as it possibly can here: it gives you the numbers, points out what follows from them, and frames recommendations in the context of your industry and brand. The last step — whether and how to act on it — stays on your side. If you want someone to talk it through with, we step in as advisors: we help build assortment and discount strategy on these numbers, set priorities, and decide where to shift budget.
Rhythm: a fixed point on the calendar
So this doesn't just fizzle out, you need one fixed point on the calendar: a short check-in where three people sit down together — someone from paid campaigns, someone from email marketing or CRM, and someone who decides on assortment and promotions. How often depends on scale: at lower volume, once a month is usually enough; at higher volume, every two weeks makes more sense. What matters more than frequency is that the slot is fixed. You go through five questions:
- How has the health of the base changed since last time?
- Which flows between segments look concerning?
- Which channel brought in customers who stick around, and which one just brought volume?
- Which of the actions launched since last time worked?
- What's the one thing we're changing before the next check-in?
Channels belong in this same rhythm, because their evaluation changes over time. Acquisition cost rises seasonally, the share of acquired customers who go loyal shifts along with creative and targeting, and a channel that looks weak under last-click can be bringing in the customers with the highest return rate. Looking at the base and the channels at the same table, you shift budget during the quarter, not after it's closed.
No materials need preparing, because the reports are already there, and you pull the answers from MCP during the meeting itself, just by asking. This check-in is where you measure the previous period's results and pick one change for the next one. Without it, campaigns launch fine, but after a quarter no one will know whether they're working.
In this process, we're your advisor, not your executor. We work on the three things that matter most for the result: setting up segmentation around your actual purchase cycle, analyzing what the numbers mean and which hypotheses are worth testing, and running the rhythm in which you measure results and pick the next step. The campaigns stay yours, and we're responsible for making sure they know who they're going to and why.
What's usually missing isn't data or hands to send things out — it's someone who regularly makes sure something actually comes out of those numbers.
Where to start
For the first full analysis, you need three things you most likely already have: order history from your store, media costs from the ad platforms, and traffic data from GA4. The rest is configuring thresholds around your purchase cycle.
On the team side: clearly assigned ownership of these campaigns and one regular check-in. The first sequences and creative are a few weeks of work spread out normally, not a separate project with its own budget and team.
Summary
Working with your customer base isn't about giving up ad spend. It's about understanding how to help existing customers buy more — and how to use that knowledge to acquire new buyers with the highest potential.
It's not a one-and-done action either. It's a rhythm: the base changes, lists refresh, and you regularly make a handful of decisions based on what actually happened, not on what seems likely.