Need help with Web&App Analytics? Let our experts take care of it!
We provide Web & App Analytics solutions, leveraging Big Data to automate reporting. Our expertise covers audits, tracking implementation, and process optimization to help businesses scale.
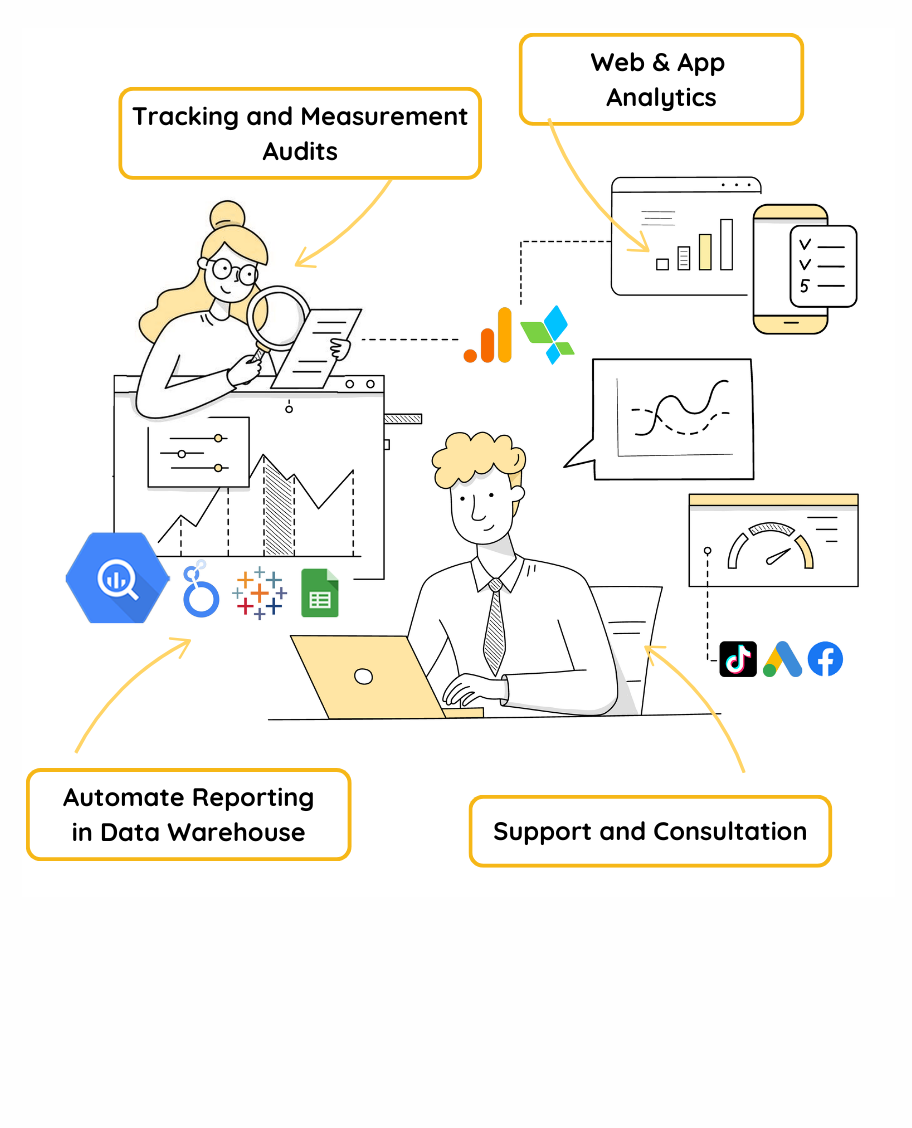

- We ensure the quality of your data
- Accurate decisions start with high-quality data. We audit your current data collection and identify any gaps, recommending corrective actions to ensure accuracy.
- Speeding up data-driven decision-making.
- No more manual data copying and report preparation. We centralize your data automatically, enriching it with AI-powered insights and visualizations for faster, smarter decisions.
- Empowering your team with valuable insights.
- We offer hands-on training and analytics workshops using tools like Google Analytics 4, Google Tag Manager, and Google BigQuery—empowering your team with valuable insights.
Experience & Partnership
We have successfully completed dozens of analytical and technological projects for companies of various sizes, including innovative market leaders. Our expertise is further validated by our strategic partnership with Google in analytics and cloud solutions.


A few words about our collaborations
At MediaExpert, we conducted an audit of the Google Analytics 4 implementation on both our website and app, carried out by the company WitBee. They helped us identify key issues we were facing, generously sharing their knowledge and expertise to resolve them. I highly recommend their services to anyone looking to thoroughly understand and improve their analytics strategy.
Agnieszka Szkudlarek
Director of Performance Marketing and E-commerce Analytics

We had an ambitiousplan to tackle event tracking and attribution modeling across various devices—web, app, cross-device. WitBee cracked it all like solving a Rubik's Cube. They have an excellent understanding of business nuances, and conversations with IT and Data Science teams are a breeze for them. Absolute professionals—I highly recommend these guys.
Katarzyna Milkiewicz
Head of B2B Key Account Management
What can we do for you?
What can we do for you?
We provide comprehensive solutions in data analytics and automation, helping companies make better decisions and grow their business based on reliable information.
- Website Analytics with GA4
- Using Google Analytics 4 and BigQuery, we help analyze user behavior and interpret results to enable better business decisions.
- Mobile App Analytics
- We assist in monitoring and analyzing mobile app data using Firebase, AppsFlyer, and Adjust. This allows you to track user journeys, measure the effectiveness of actions, and optimize app development based on reliable data.
- Script Implementation
- We implement and configure Google Tag Manager (Web & Server), Google Analytics 4, Meta API, and other solutions to ensure full control over data, enable effective conversion tracking, and optimize marketing activities.
- Business and Marketing Data Integration
- We combine data from various sources in BigQuery, creating a single source of truth. This enables you to automate analytical processes and better manage information within your organization.
- Reporting Automation
- We use BigQuery and Looker Studio to create clear and dynamic reports. We automate the analysis process by providing ready-to-use dashboards that support business decision-making.
- Team Training
- We offer training tailored to your needs – from analytics fundamentals to advanced configurations in GA4, GTM, BigQuery, and Looker Studio. This ensures your team gains practical skills and full control over data.
Proven and scalable solutions
Proven and scalable solutions
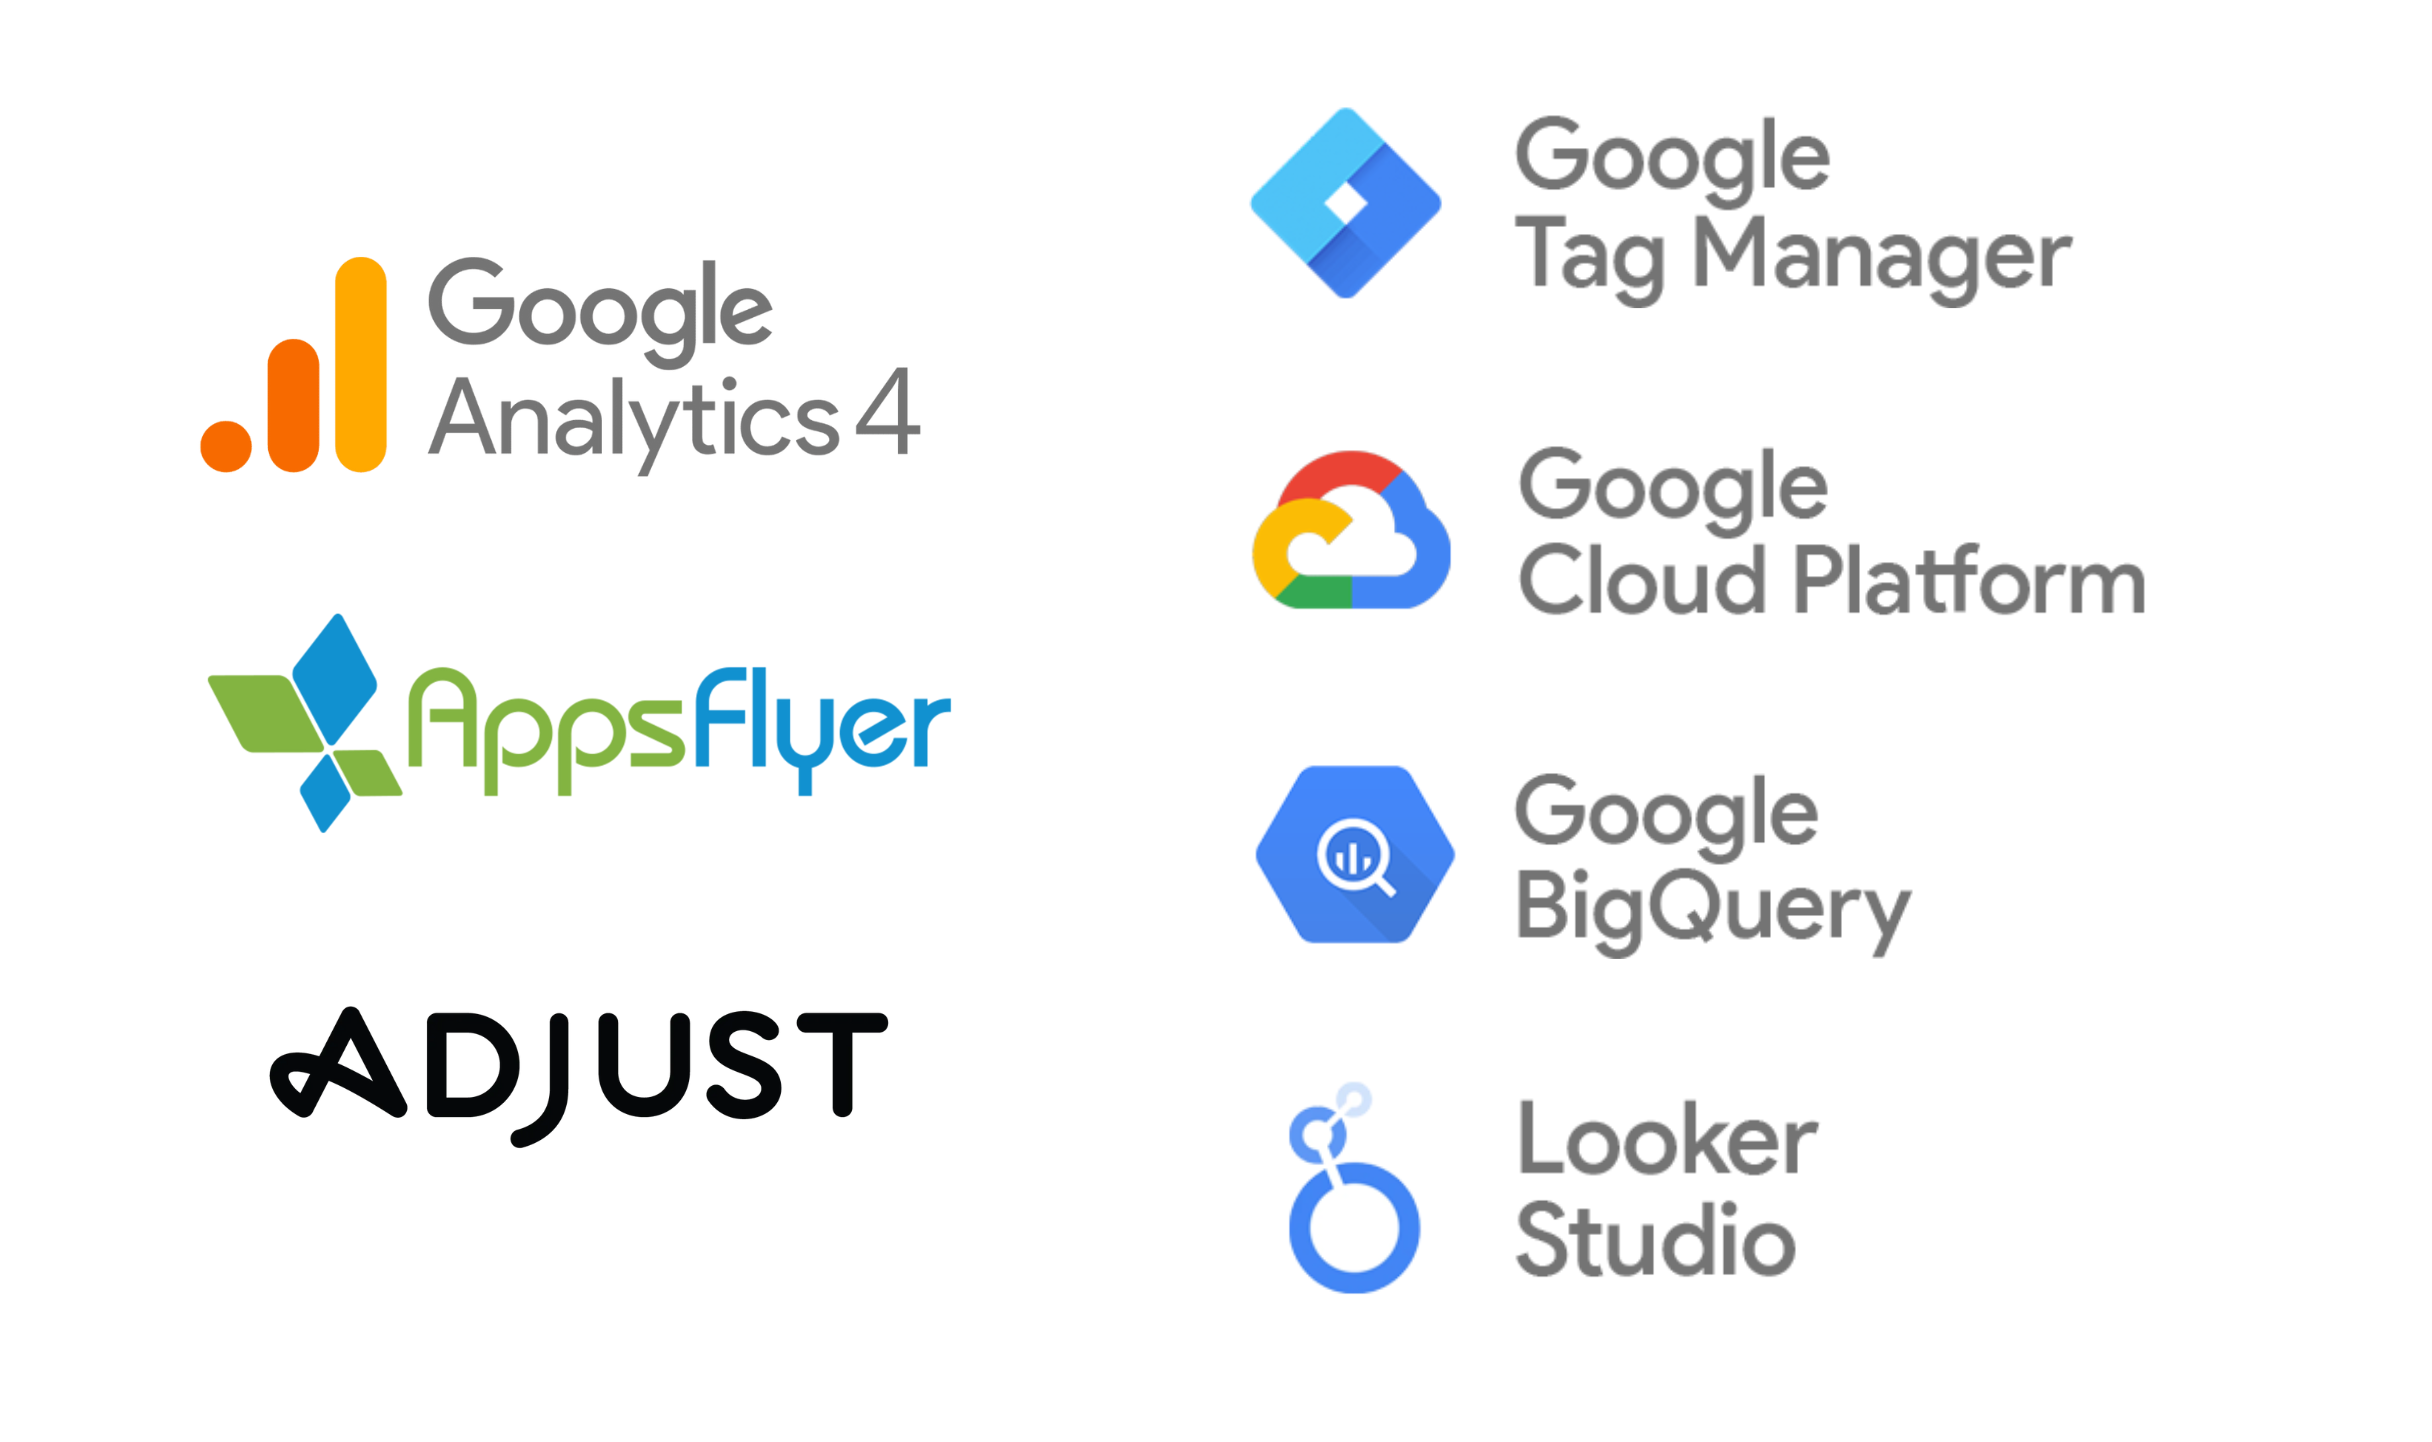
What technologies do we use?
We rely on modern analytical and cloud-based tools that allow us to measure results, optimize operations, and deliver better solutions.
Web & App Analytics Platforms
We use Google Analytics 4, Firebase, AppsFlyer, and Adjust to analyze user behavior and optimize business performance.
Google Tag Manager - Web & Server
With GTM, we efficiently manage tags on websites and applications, minimizing site load and ensuring full control over data.
Google Cloud, BigQuery & Looker Studio
We leverage Google Cloud, BigQuery, and Looker Studio for data analysis and the creation of clear reports that support business decisions.
Automation of reporting
Automation of reporting
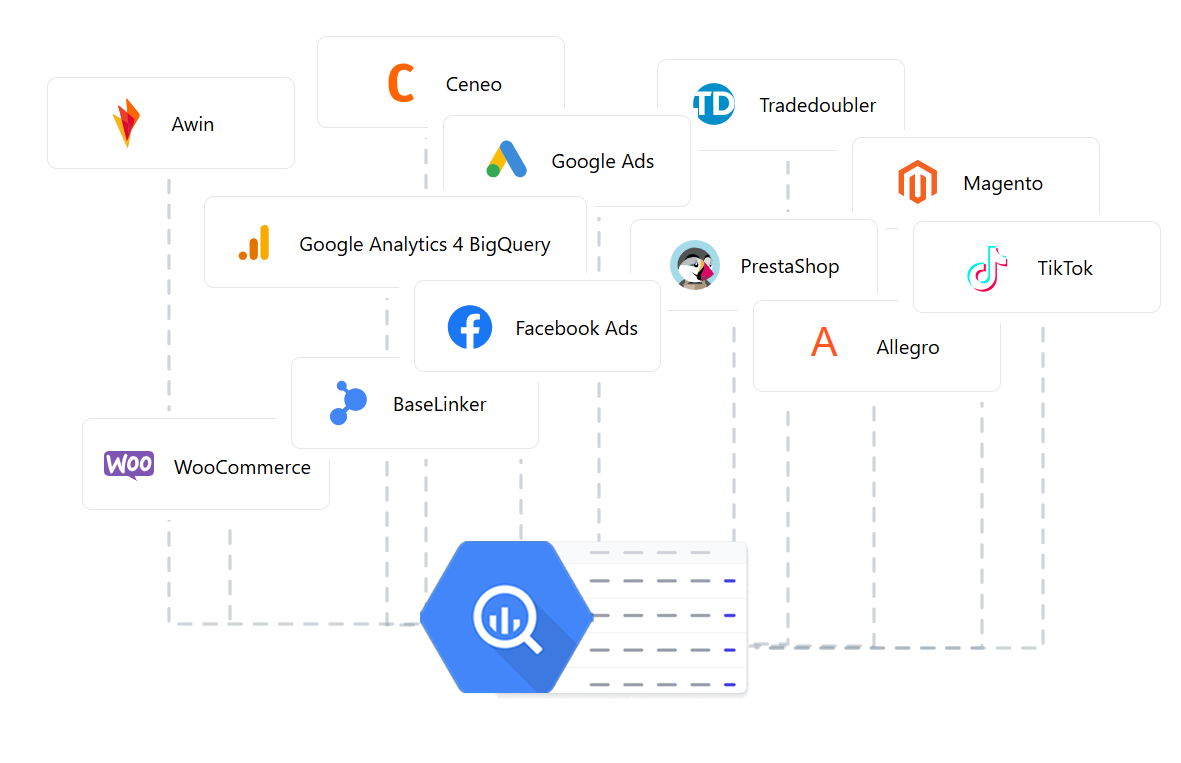
WitCloud Platform
As the creators of WitCloud Platform, we provide intelligent reporting based on reliable data. Our solution enables automatic data collection, organization, and analysis from multiple sources – with no coding required!
Collect your data in one place – effortlessly!
Easily gather all your data in Google BigQuery with just a few clicks. No coding required—seamless automation does the work for you.
Organise your data in a smart way:
Combine and organize your data so that it is easy to use.
Visualise and analise:
Having properly prepared data, create reports tailored to your needs and start using them on a daily basis.
Ready to unlock new opportunities?
Ready to unlock new opportunities?
Discover how we can help you leverage data and boost your business efficiency. Book a free consultation and explore the best solutions for your needs!