
A series of articles on Google Analytics 4 GA4 data in BigQuery
This article is part of a series of posts about Google Analytics 4 and the export of data to Google BigQuery. It consists of the following components:
- #1 Google Analytics 4 BigQuery – why you should use it? (which you are currently reading)
- #2 Google Analytics 4 BigQuery – 9 challenges that are sure to surprise you when analysing your data
- #3 Google Analytics 4 BigQuery – traffic sources, sessions, attribution, marketing costs and ready-to-analyse data
Getting started – Google Analytics 4 and Google BigQuery
Why is the Google Analytics interface not enough?
The moment you implement Google Analytics 4 on a website or app, you start sending information about user events to Google's database. Based on this data, various types of reports are displayed in the Google Analytics 4 interface.
Browsing data in the Google Analytics 4 interface can be an enjoyable task. Sometimes, however, you may encounter various types of constraints while running an analysis, e.g.:
- the data is sampled, which means that the results are presented on the basis of a sample of data rather than all the information collected
- some metrics and dimensions cannot be combined as the system does not allow it
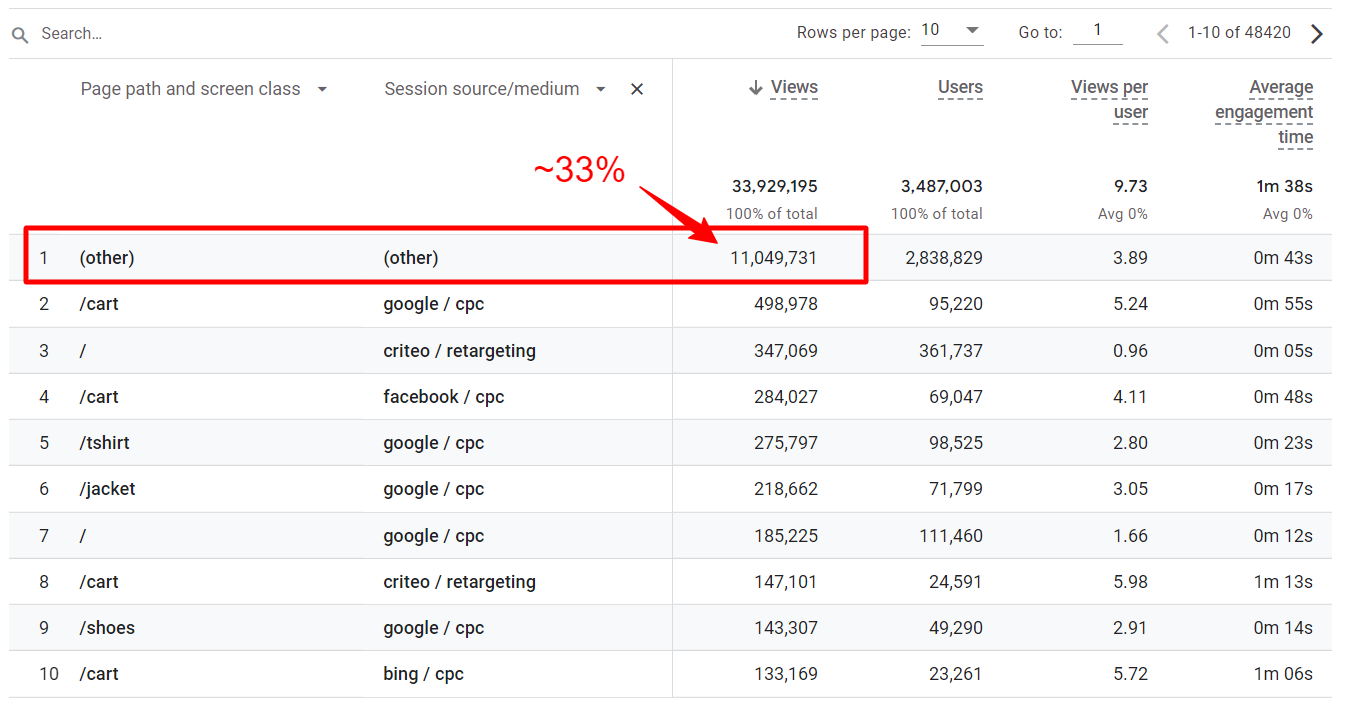
- there is too much data as a result of which many dimensions, e.g. URLs or product names, are suddenly hidden under the name “(other)”
We often want to pull data from Google Analytics out of the system and perform additional tasks, e.g.:
- build a dashboard containing Google Analytics data and all marketing costs so as to be able to calculate ROAS or ERS for individual channels
- combine Google Analytics data with CRM data, e.g. order status information
- measure marketing campaign attribution using data that includes product margins
This is also when we face various limitations, e.g.:
- we are surprised by the limits of exported rows from Google Analytics and the number of possible API queries
- we cannot extract just some of the information at a certain level, e.g. user ID or transaction, only aggregated calculated values that we cannot modify in any way
Google Analytics 4 GA4 BigQuery Export
We could list many more examples and limitations for different projects. In response to all the above problems and challenges, Google has released a service for exporting raw data from Google Analytics 4 to BigQuery (we will explain the choice of this tool in particular later in the post), i.e. data that the former uses to prepare all reports in the panel. They contain very detailed information about each event sent by the user with all the attributes, i.e.: device ID, the exact time of the event, event name and its parameters, geolocation information and all data collected through the e-commerce module.
The idea is simple – if you want to keep the data we collect for you for longer and use it for your analyses and business purposes, you now have the opportunity to do so.
Not only large but also small and medium-sized entrepreneurs have a chance to take action!
In the past, when using the Google Analytics Universal tool, only the largest players could afford to export raw data, namely companies that could afford to pay a minimum of tens of thousands of dollars annually for the Google Analytics 360 service (premium version). At present, this option is available free of charge to all companies using Google Analytics 4. This is an opportunity that can be tapped into not only by large companies and corporations but also by small and medium-sized entrepreneurs who want to use Google Analytics 4 data to make better business decisions.
Why is Google Analytics 4 data exported to Google BigQuery and not to a spreadsheet or Excel?
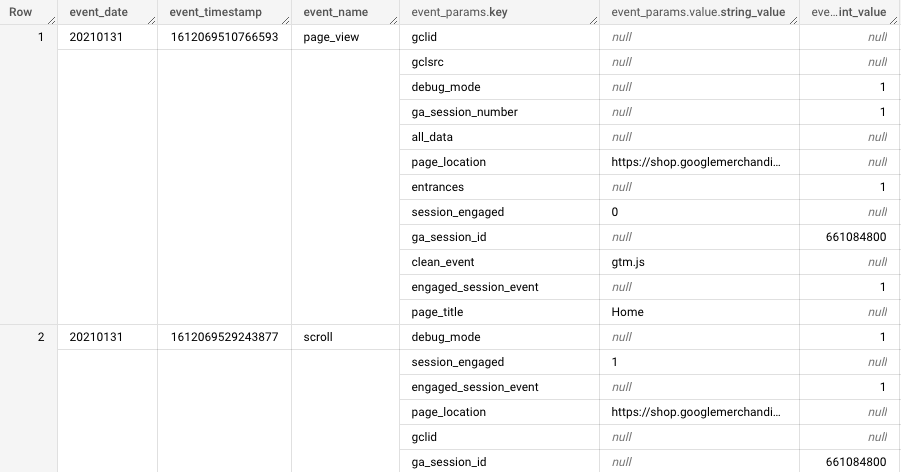
Structure of transmitted events
The data table diagram itself contains over 100 columns featuring diverse values, displayed in various structures. Events often contain a lot of additional information such as several parameters or a couple of purchased products. Browsing this type of data in spreadsheets before making an appropriate selection would be difficult.
Data size
For the purposes of this article, we checked a small online store, visited on a given day by 2,200 users – such a store generated 50 MB of data in a single day. Assuming that we would like to analyse all the data of this store, e.g. from an entire year, the file with the table would have to weigh ca. 18 GB – no spreadsheet can easily accommodate a file this size, not to mention performing additional operations such as calculations, sorting or filtering. For reference, large companies can collect from several dozen to even several hundred GB of information in one day in Google Analytics. Special tools had to be developed to store such large datasets and analyse them.
Google BigQuery – a modern data warehouse in the cloud
Google, whose mission is to "organise the world's information and make it universally accessible and useful," needed to analyse very large datasets from all its services, i.e. Google Search, YouTube, Google Maps and others. To meet that end, a technology called Google BigQuery was created, which has the capacity to store and analyse data of
enormous size. Google BigQuery is commonly referred to as "a petabyte-scale data warehouse".
1 PETABYTE = 1,000 TERABYTES = 1 MLN GB
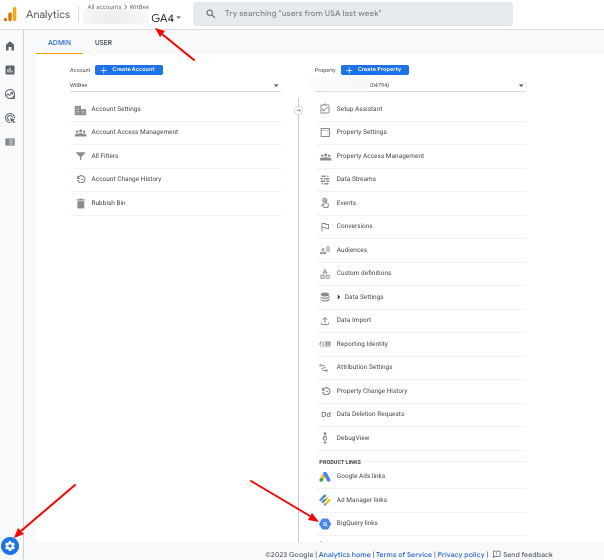
Having two products, i.e. Google Analytics and Google BigQuery, and customers of different scales, Google decided to integrate the two. This made it possible to start automatic export of Google Analytics data to Google BigQuery with just a few clicks. As previously mentioned, this service was available in Google Analytics Universal only to premium customers. Now anyone who has Google Analytics can perform such integration by going into the administrative settings. The details are covered in the documentation at this link: Configuring Google Analytics 4 BigQuery Export.
Google Analytics 4 GA4 - exploring data in BigQuery
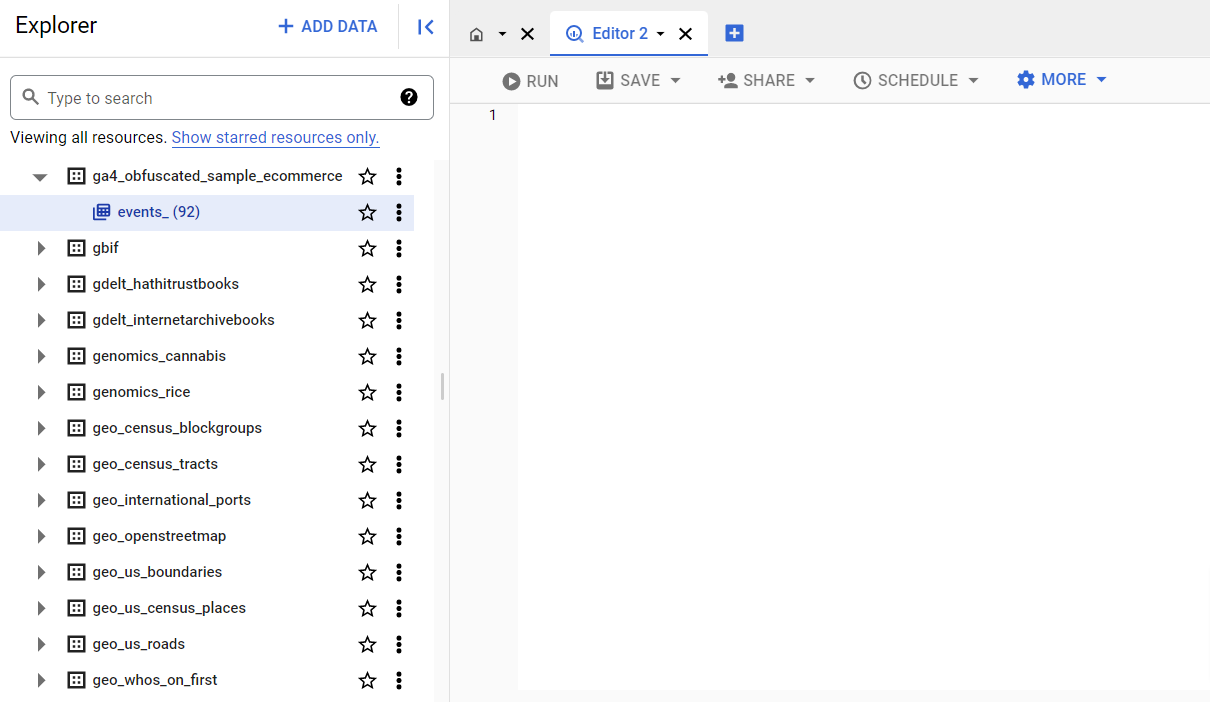
After exporting the data, it's time to mine it in the Google BigQuery interface. The Google BigQuery interface is quite simple and intuitive. On the left is a list of our datasets and tables available for analysis. The remaining and largest part of the interface is taken up by the field where you need to write and run an SQL query.
The thing is, in order to analyse data in Google BigQuery, you need to learn the database SQL (Structured Query Language) as Google BigQuery currently supports neither English :).
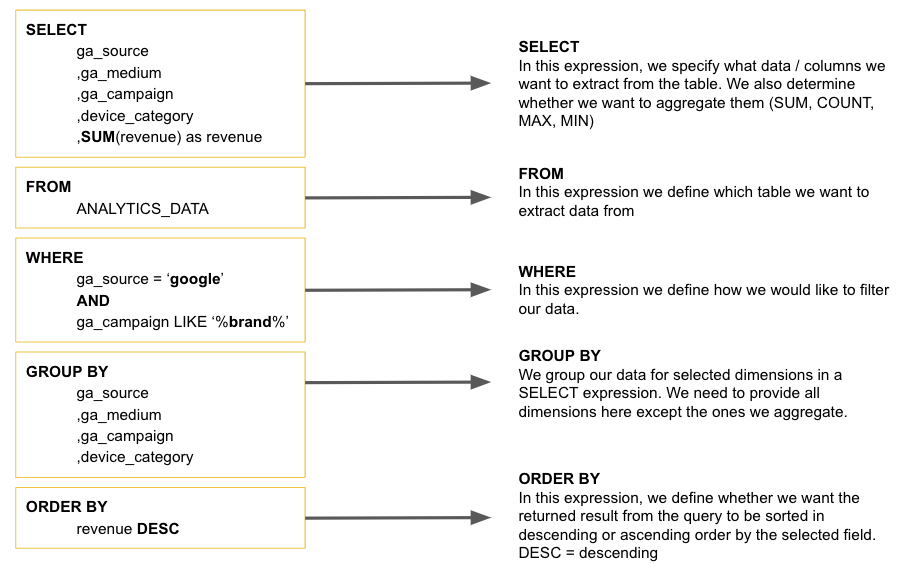
After launching the query, we receive feedback in the form of a table, which we can then save or export to other tools, e.g. Looker Studio, Google Sheets or Excel via a CSV file. Below is an example query yielding the TOP 10 products added to the cart based on data from Google Analytics 4.
If you plan to export via Google Analytics 4 to BigQuery, it is worth embarking on your learning adventure with SQL, where the entry barrier is much lower than when delving into the world of programming.
Below is a handful of useful resources on this topic:
- w3schools - SQL Tutorial
- Examples of basic SQL queries regarding Google Analytics 4 data
- The book Google BigQuery: The Definitive Guide: Data Warehousing, Analytics, and Machine Learning at Scale
- Simo Ahava - #BIGQUERYTIPS: QUERY GUIDE TO GOOGLE ANALYTICS: APP + WEB
- Google BigQuery documentation
A few reasons why you should get started with Google Analytics 4 export in BigQuery
Now that we've covered the basics of exporting data to Google Analytics 4, it's time to learn about some important reasons that should prompt any company to start performing their analytics in Google BigQuery.
If you don't enable data export to Google BigQuery, you will lose your historical data.
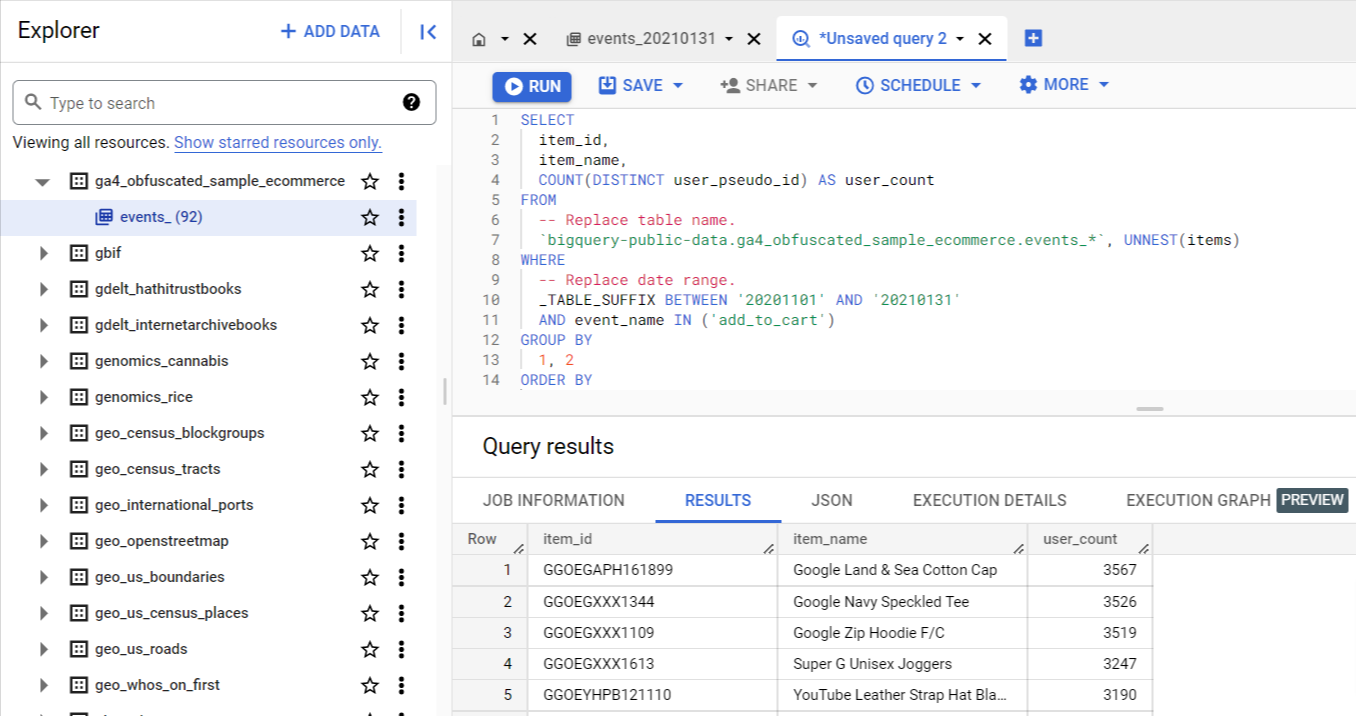
In the case of Google Analytics Universal, you had the option to set automatic data deletion after 14, 26, 38 and 50 months. You could also opt out, which meant that data for analysis in Google Analytics was available from as long as 50 months back.
Google Analytics Universal – data retention settings
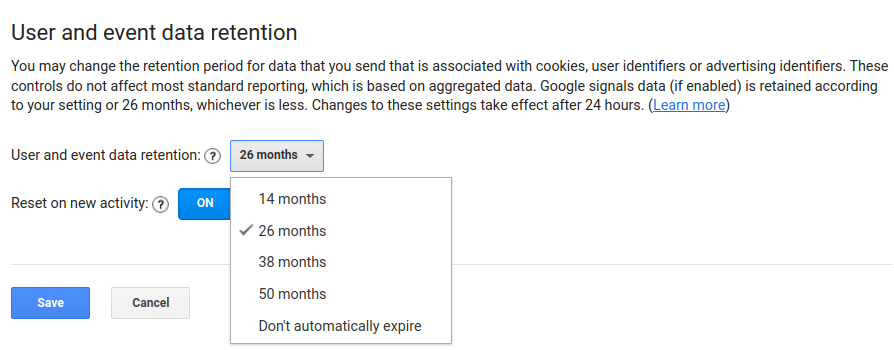
In Google Analytics 4, the default retention time of your data is set to 2 months – if you have this option left unaltered, it is a good idea to change it by going to Administration -> Service Settings -> Data Retention. In the free version, you can extend the range to a maximum of 14 months. In the paid version of Google Analytics 4 Premium, it is possible to extend retention to 26, 38 and 50 months, however, the option to keep data indefinitely is not available.
Google Analytics 4 GA4– data retention settings
Data in BigQuery can be stored indefinitely – the catch is that data in BigQuery appears only from the moment of its configuration, so if you want to access historical data, you should enable data export to Google BigQuery as soon as possible.
Google Analytics 4 data visualisations in Looker Studio – in BigQuery there are no API limits
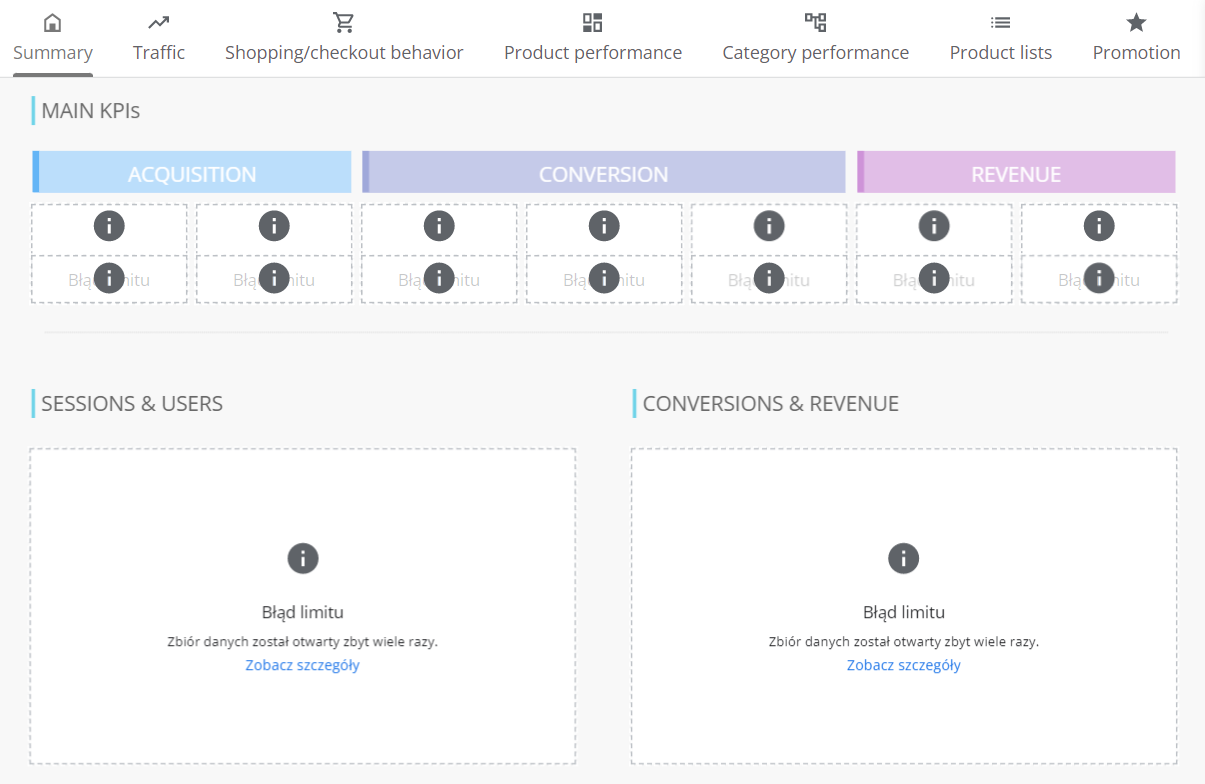
A popular solution for data visualisation outside of the Google Analytics 4 panel is Looker Studio, formerly known as Google Data Studio. Google Analytics 4 is programmatically integrated with this tool via API (Application Programming Interface), which allows you to quickly and easily create your own visualisations in the form of tables and charts. In November 2022, many companies that had analytical dashboards in Looker Studio, instead of tables and charts, saw a message informing them that the previously mentioned API had exceeded its data download limits. And this is what the reports looked like:
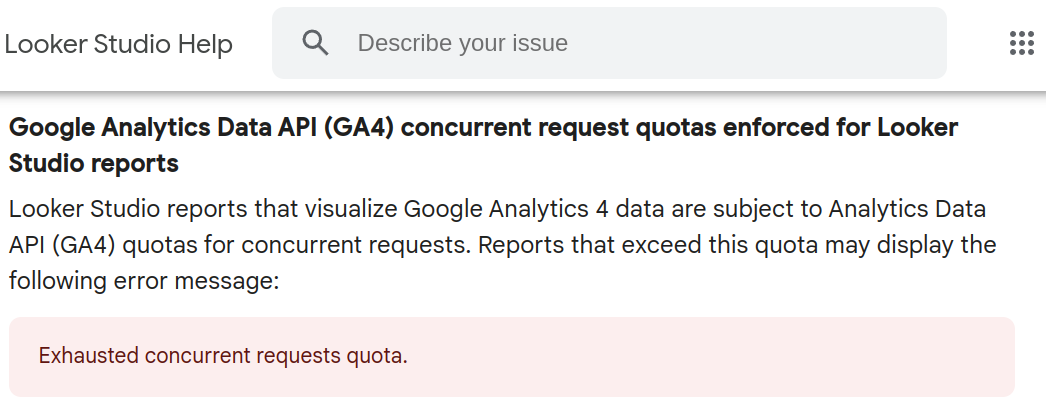
An official announcement on this matter appeared in the Looker Studio documentation, which referred to the imposed limits in the Google Analytics Data API. A link to the published statement can be found here..
Google even introduced a tool to monitor the number of queries from this connector so as to better estimate the extent to which the limits of data downloaded by your dashboards are exceeded. If such limits are exceeded, one of the recommended options is to reduce the number of visualisations as well as access to a report in the organisation or to export data from Google Analytics 4 to Google BigQuery.
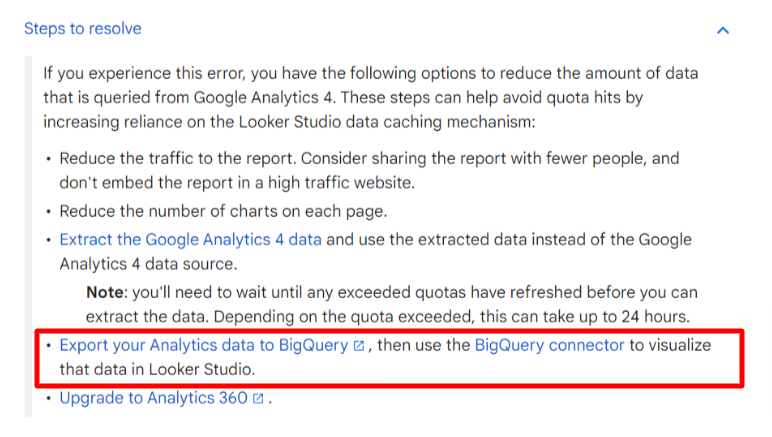
When you are connected via the Google BigQuery connector, queries are sent to Google BigQuery and not to the Google Analytics Data API, thanks to which you bypass query limits for historical data. Data visualisation based on tables from Google BigQuery is therefore another benefit here if you want to have constant access to reporting without fretting over any limits.
Interface data sampling – a piece of cake for BigQuery
The exploration section of the Google Analytics 4 panel features many options for visualising and reporting the collected data. Some of them, depending on the selected metrics and dimensions, require hefty calculations, which may ultimately result in data sampling. When a larger number of events need to be processed within a given query, Google Analytics will use a sample of available data. In the case of the free version of Google Analytics, the limit is 10 million events, for the paid premium version it stands at 1 billion events.
In the screenshot below, you can see a recommended cohort report running in the template gallery. Without modifying any parameters, an exclamation mark appears, informing us about a large sampling of data – this report was prepared on the basis of 6.91% of all information available to Google Analytics, therefore it is most likely highly inaccurate. Referring to this example when analysing other data, you may encounter many such cases that can significantly hinder decision-making.
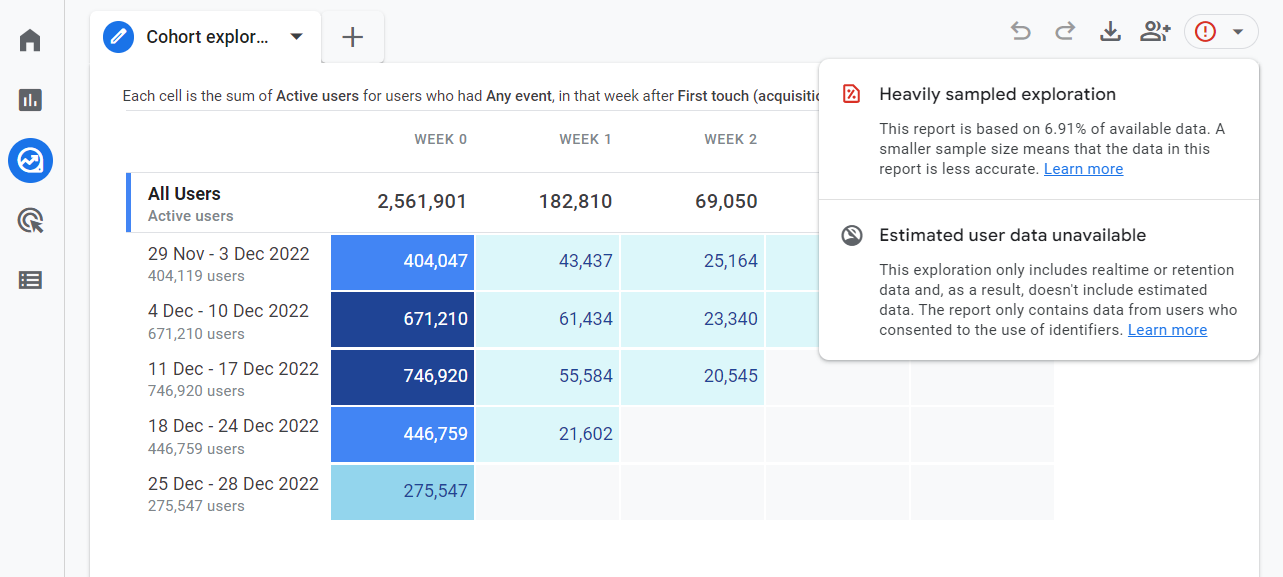
When preparing reports in Google BigQuery, you have access to all the collected data and you can prepare such a report as well as many others without sampling. This is not possible in this case in the interface.
Data cardinality – in BigQuery the level of data aggregation is all up to you
Data cardinality occurs when the analysis scope adopted in the report contains too many rows. It could include, for example, a URL, product ID, user ID or multiple combinations of traffic sources. Due to the cardinality of data, you may come across differing values in standard reports and mining reports using the same dimensions and metrics. The cardinality of data in the Google Analytics 4 panel also inserts a row item called "(other)" each time the row limit is reached. No such situation will occur in Google BigQuery because you decide on the level of aggregation of the data which you want to work on.
Possibility of linking Google Analytics data to other systems
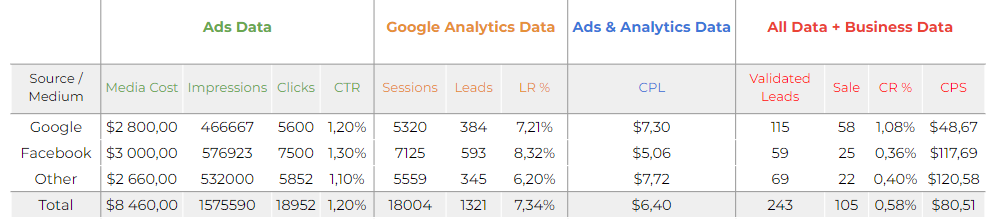
You can input a lot of business-related data other than Google Analytics into Google BigQuery, for example, information about advertising costs, statuses from CRM systems, data from Google Merchant Center and much more. You can put it all together and prepare one table, i.e. a so-called 'Data Mart'. You can then visualise such a table on the dashboard, e.g. in Looker Studio, and constantly monitor the marketing performance of your business. Such things are possible without coding thanks to ready-made solutions that automate the collection and reporting of data.

Validation and continuous monitoring of implementations based on data in Google BigQuery
GA4 data in BigQuery makes it easy to verify reports and event implementations. With all the detailed information at our disposal, including the user ID and the timestamp of each event, you are able to precisely analyse the values sent to Google Analytics when a user interacts with the website. With the aid of appropriate SQL queries, you can detect anomalies in the data or check irregularities related to the sequence of events sent without bypassing the system’s stumbling blocks, i.e. sampling or data cardinality. If a business introduces many changes to a website or app, the constant monitoring of values sent to Google Analytics allows you to quickly react to changes, e.g. an incorrectly sent parameter.
Ability to use data for forecasting and prediction with BigQuery ML
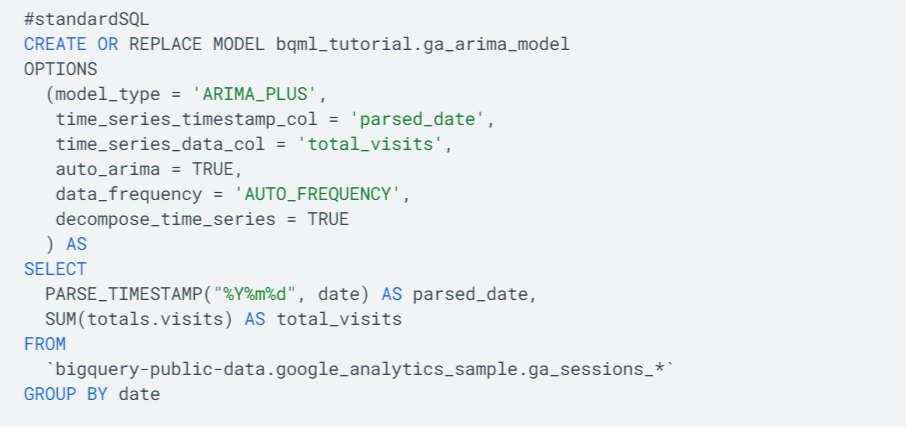
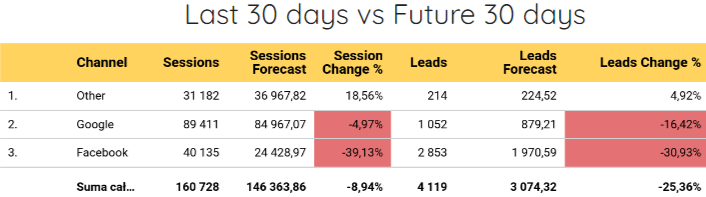
Ability to use data for forecasting and prediction with BigQuery ML The use of machine learning in marketing is already becoming a standard. With data in Google BigQuery, you can keep up with these trends and use them to build predictions or forecasts based on our data without having to code in languages like Python or Java. The BigQuery ML Module allows you to create models, forecasts and predictions based on SQL, which significantly reduces the barrier to entry into this area and opens up new possibilities, including forecasting traffic and sales from individual marketing channels, detecting anomalies in data, building advanced segmentation for users or creating custom attribution models.
So, if you think the answers to the following questions would be useful to you, BigQuery ML is the solution that can help:
- How much revenue has my business
generated/ will generate ? - How much have we
spent/ will we spend on media? - Which products will sell and how much will it cost us?
- How much have
we earned/ will we earn from all this?
Raw and unsampled data almost "for free" – let's take a look at the costs
As we mentioned at the beginning of the article, with Google Analytics Universal the matter was simple: if you wanted to have unsampled Google Analytics data in BigQuery, you had to have Google Analytics Premium that cost tens of thousands dollars a year. Now you have the opportunity to enable this service free of charge.
Google BigQuery itself is a paid service that belongs to the Google Cloud Platform product family. If you set up a billing account in Google Cloud Platform for the first time, you get $300 to use for the first 90 days. Therefore, you can start analysing data for free.
Also, it is worth recalling that BigQuery was created for the analysis of very large datasets. As such, the price list of this tool has been tailored to major players, which means that small, medium-sized and sometimes even large enterprises have the opportunity to use great technology at a very low price.
Google BigQuery monthly billing is determined by three elements:
- $0.02 per month for each GB stored in Google BigQuery, with the first 10 GB being free
- $5 for each TB processed when running SQL queries on data, with 1 TB per month being free
- $0.05 for each transferred GB in a real-time data stream (if this option is enabled)
According to the information contained in the documentation, 1 GB of data amounts to ca. 600,000 Google Analytics events. In order to illustrate this figure, we checked an online store which was visited by 260,000 users in one month. Such a store generated 6 million events, which yields an average of 200,000 events per day.
To simplify calculations, below is an example estimate for a business generating 600,000 events per day.
Real-time data streaming
30 days x 1GB x $0.05 = $1.5 for sending 18 MLN events to Google BigQuery per month
Data storage
The data will increase every day, so the cost of storage will also increase every month. In order to illustrate the costs, we present it in full denominations.
1st month: (30 GB – 10 GB for free) * $0.02 = 20 GB * $0.02 = $0.4
2nd month: (60 GB – 10 GB for free) * $0.02 = 50 GB * $0.02 = $1
3rd month: (90 GB – 10 GB for free) * $0.02 = 80 GB * $0.02 = $1.6
…
12th month: (360 GB – 10 GB for free) * $0.02 = $7
Performing SQL queries on data
When executing a SQL query on data, you can select only the information that is of interest to you. Therefore, not all the information you have has to being processed. For instance, we checked a business with ca. 1 GB of data and 3 quite extensive reports in Looker Studio refreshed every hour. This business processed 1.5 TB of data per month.
(1.5 TB – 1 TB for free) * 5$ = 0.5 TB for $5 = $2.5
The costs of performing queries depend on many issues and so they may vary for individual businesses. A few factors that can affect the costs are as follows:
- the size of the batch data for the report
- the number of reports
- quality of written queries (you can often achieve the same effect many times cheaper, avoiding errors in SQL syntax)
- traffic on reports connected to, for example, Looker Studio. Each chart or table executes a SQL query to BigQuery, which involves the accrual of additional MB
The total monthly cost for a business generating 600,000 events per day
Assuming that you already have a complete set of data from one year, you will pay $11:
$7 for storage + $1.5 for streaming + $2.5 for polling = $11
For stores that generate far fewer than 600,000 events per month, this service can be practically free.
Summary
Exporting Google Analytics 4 data to Google BigQuery allows you to prevent data loss and bypass numerous limits and restrictions that await in the panel or API connection. Also, it is a good place to start building your own data warehouse, where you will collect more information, including that concerning advertising costs or statuses from CRM systems. This tool was created for big players, so there is no major barrier to entry when it comes to the price of this solution. If you start using this technology more often, you can leap into the world of machine learning in a relatively simple way and start making better predictions. Companies that start to efficiently use this technology in business will gain a substantial competitive edge on the market.