Continuation of a series of posts about Google Analytics 4 data in BigQuery
This article is part of a series of posts about Google Analytics 4 as well as data export to Google BigQuery. It consists of the following items:
- #1 Google Analytics 4 BigQuery – why should you use it?
- #2 Google Analytics 4 BigQuery – 9 challenges that are sure to surprise you when analysing your data
- #3 Google Analytics 4 BigQuery – traffic sources, sessions, attribution, marketing costs and ready-to-analyse data (which you are currently reading)
The last post was about analytical challenges related to data analysis in Google BigQuery. Companies as well as analysts and specialists working for them should focus mainly on making decisions based on data, and not on laborious and expensive preparation as well as processing of data for their analysis.
In response to this challenge, in our WitCloud platform we decided to create an analytical module that, based on the exported Google Analytics 4 data to Google BigQuery, will solve problems with their processing and prepare these data in such a form so that they are ready for use in the company for various analyzes or integration with other systems.
In this article, we will step by step discuss what modifications we have made to the data and how we approached the design of the data structure in Google BigQuery.
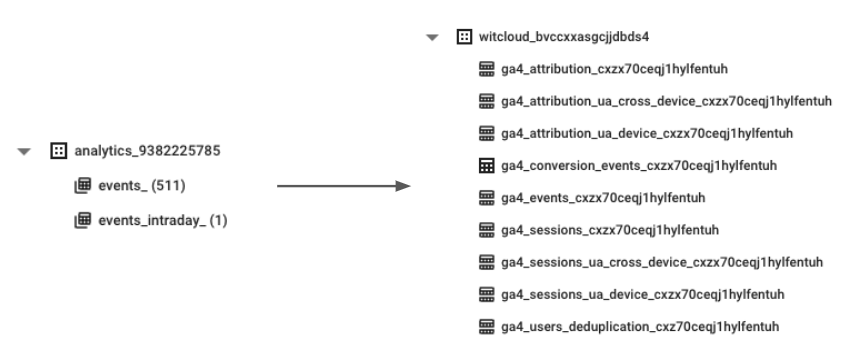
Enriching the events table with traffic sources
The issue of poor traffic source data in Google Analytics 4 GA4 BigQuery Export
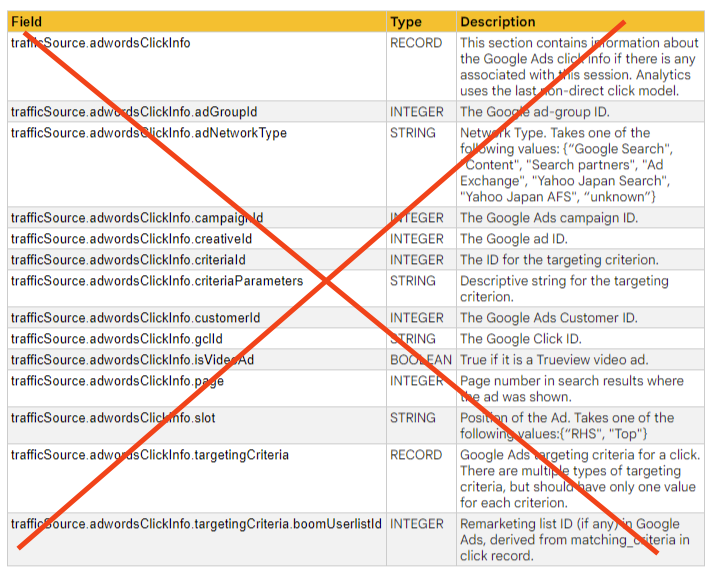
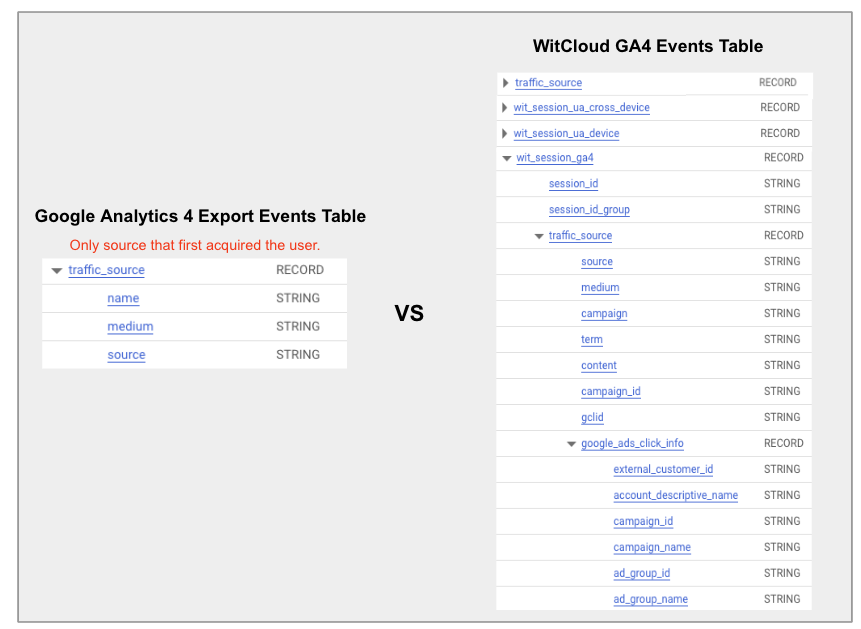
In article #2 Google Analytics 4 BigQuery - 9 challenges, that will surprise you when analyzing data, we raised the problem of the lack of calculated traffic sources for specific sessions and poor access to Google Ads data. In the default exported “events_” table we have only the following fields available, i.e. traffic_source.source, traffic_source.medium, traffic_source.name (campaign name).
Referring to our previous article; however, the problem is that these are fields that inform us about what source occurred in the first campaign of the time of acquiring this user, and not about the source that occurred in a given session, as we can view it in the reports and the "Session source/medium" dimension in the Google Analytics 4 panel. This means that in the panel, Google provides us with processed data, and we will have to do it ourselves using raw data in BigQuery.

Using these fields in the table, we will achieve a different image than in the case of the “Session source / medium” dimension in the panel.

Moreover, the table lacks more detailed information about Google Ads campaigns, as was the case in the export of data of Google Analytics Universal 360 (premium version)
The solution to the problem is all about enriching the events tables with the sources of session traffic in the Google Analytics 4 and Universal Analytics models.
In response to this challenge, we decided to enrich the "events_" table with additional groups of fields that provide information about the sources of traffic that occur in a particular session as well as additional information about the Google Ads campaign.
The data was enriched in the Google Analytics 4 model, which does not create a new session when changing the campaign source during the session, and in the Google Universal Analytics model, which creates a new session every time a new traffic source appears.
Ability to track users between different devices
Before we discuss how individual models work on cases, we must mention a significant factor that we had to take into consideration when creating the module, i.e. tracking users between devices such as computers, smartphones and tablets (cross-device).
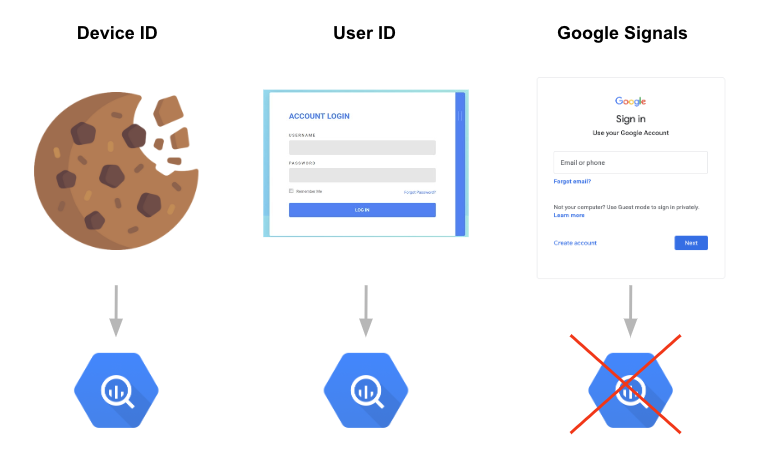
Google Analytics 4 has appropriate functionalities that can connect events on the user's path based on 3 dimensions, i.e.:
- Device ID, i.e. a browser cookie or an identifier in the application
- User ID, i.e. an implementable user ID from our database, e.g. after registering/logging in to our website/application
- Google ID (Google Signals), i.e. an identifier connected to a logged-in user in Google (requires additional activation in the administrative settings of the service)
By default, Google Analytics only tracks the user based on Device ID, which is a cookie or application ID. This means that if we enter the selected website from a mobile device and then from a desktop computer, Google Analytics will report information about 2 different users acquired from 2 different channels. Based on this, it is not possible to track users between devices, because each device and each browser will have a different user ID.
However, if we decide to send our own user ID in the implementation, e.g. after logging in/registering or activating the Google Signals option, Google will perform a deduplication of users on all collected data, i.e. it will find a connection between devices and provide us with more accurate data on users as well as their behaviour.
In the Google Analytics 4 panel, we can decide whether we want to see data with or without deduplication based on the "Reporting Identity" settings.
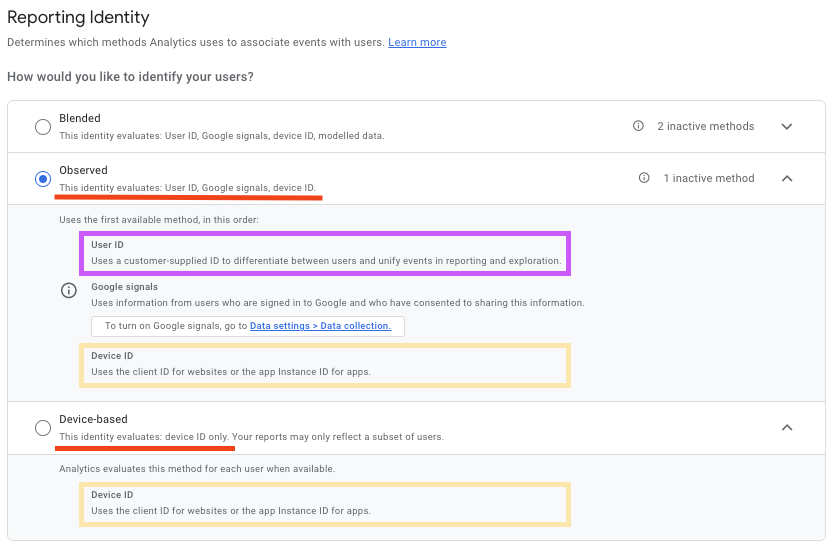
In Google BigQuery, we can perform user deduplication only on the basis of 2 dimensions, i.e. Device ID and User ID, because as far as legal aspects are concerned, Google Signals data is not shared in the Google Analytics 4 data export.
Sessions & Traffic Source Approach - Google Analytics 4 vs Google Analytics Universal
The following diagram will allow us to better answer 2 significant and related to each other questions:
- How does deduplication of users using the user_id parameter affect the attribution of traffic sources?
- How has the logic of counting sessions in Google Analytics 4 vs Google Analytics Universal changed?
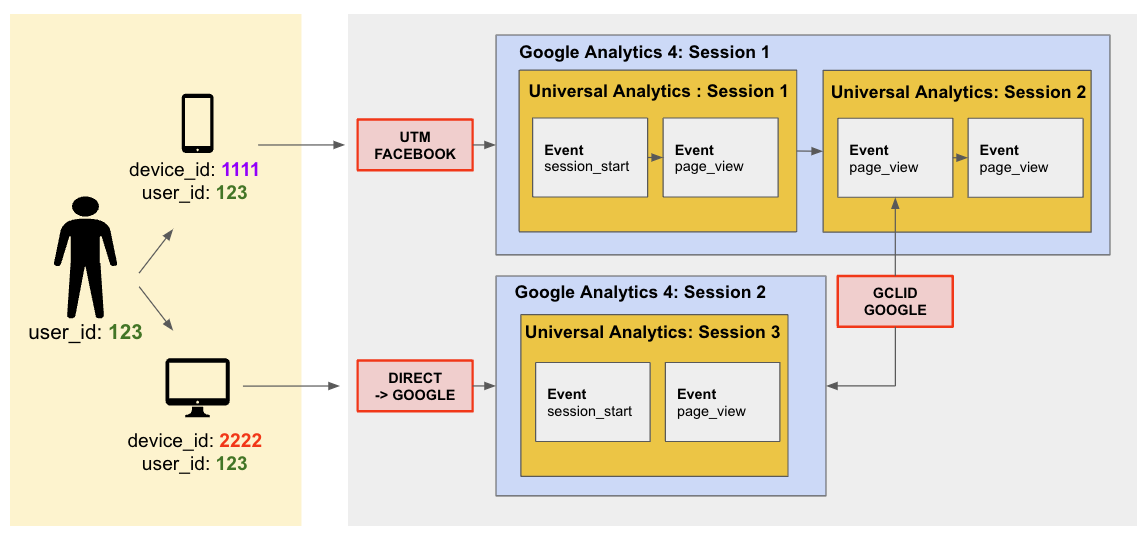
Brief description of the scheme:
- The user entered the website from a mobile device after being referred from Facebook, which resulted in the creation of a new session
- During the session generated by Facebook (within 30 minutes of the lack of interaction), the user clicked on the page again through a Google Ad
- After some time, the user decided to enter the website again, this time from a desktop computer without being redirected (direct entry)
- On both mobile and desktop devices, the user was logged in and the “user_id” parameter was sent
Now let's take a look at how traffic source attribution and session calculation for each model will behave.
Google Analytics 4 - Cross Device Model

In the Google Analytics 4 - Cross Device model, when the user enters a website from a mobile device and is redirected from Facebook, a new session will be created. When a user clicks through a Google ad from the same device during a session, no new session is created because Google Analytics 4 does not create a new session when the campaign source changes during the previous session. The moment the user enters a website from a desktop device and it is a direct entry (“Direct” traffic), this source will be overwritten with the last source of traffic that occurred in the previous session - it will not be Facebook, but Google, which previously did not cause the creation of a new session on a mobile device.
Google Analytics 4 - Device Model

In the Google Analytics 4 model based on Device ID (in the case of a website, this will be a cookie), each browser will have a new user ID generated. In such a situation, the first session will have a Facebook source assigned, and the second session, which occured on another device, will have a “Direct” source. Google campaigns will be ignored in this case, because the logic of Google Analytics 4 does not take into consideration the creation of a new session when changing the traffic source. The second session (direct entry) will not inherit the traffic source, as it is in no way related to the previous device (no deduplication and use of user_id). It will be direct, then.
Universal Analytics - Device Model

In the Universal Analytics model based on Device ID (currently and historically used in Google Analytics Universal), the Facebook source will be assigned in the first session. A new session will then be created for the Google source, as Universal Analytics creates a new session each time the campaign source is changed during the session. When the user enters directly from the desktop device, a third session will be created, which will not be overwritten with a Google value, as it is not in any way related to the previous device (no deduplication and use of user_id). It will be direct, then.
Universal Analytics - Cross-Device Model

The Universal Analytics model based on cross-device is a novelty that we decided to recreate on the basis of a dedicated approach related to user deduplication in Google Analytics 4, but keeping the old approach, which assumes creating a new session when the source of the campaign changes during the session. In this way, the first session will have the ‘facebook’ value, then a new session will be created, for the Google source, because Universal Analytics creates a new session every time the campaign source changes during the session. After direct input from the desktop device, a third session will be created, which will be overwritten with Google value, because we are able to connect users to each other on the basis of deduplication using user_id.
Why have we prepared three data models?
Decisions about reporting with the use of the chosen Google Analytics model may depend on the preferences of the organization. That is why, we wanted each company to be able to make its own decisions about this choice or be able to compare data in different models.
For this reason, we have prepared data in 3 models, i.e.:
- Google Analytics 4 Cross Device including Deduplication
- Google Analytics Universal Cross Device including deduplication
- Google Analytics Universal Device without deduplication (known and liked from Google Analytics Universal)
Event grouping into sessions, i.e. session tables for Google Analytics 4 data
Event Table vs Session Table
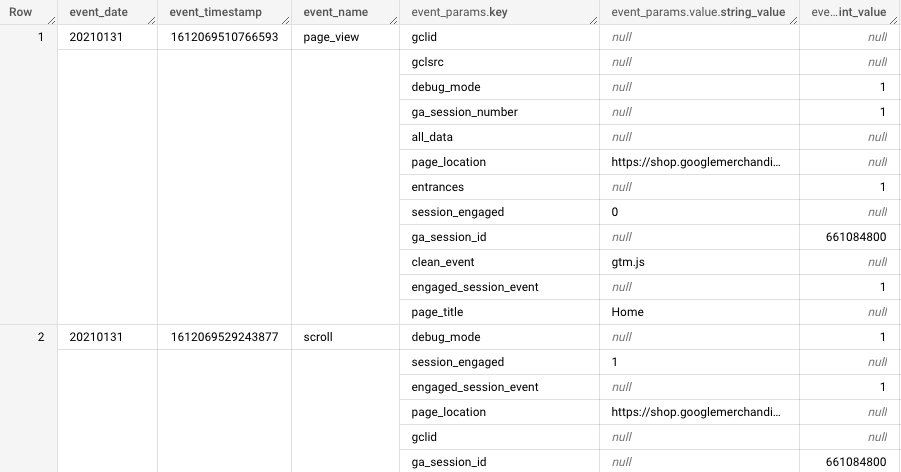
An event table is a table that contains rows, each of them corresponds to a single event with all the attributes collected based on the implementation on the website or in the application. This is how Google Analytics 4 data is dumped when we start the function of exporting it to Google BigQuery. It enables to view all event parameters in great detail.
A session table is a table that contains rows, each of them corresponds to one session - it contains grouped and calculated information based on all events that occurred in the event table.

Why did we decide to create a session table?
The key issue was to provide a relatively light table for the tools responsible for data visualization. The session table, due to the fact that it has aggregated and converted values, takes up much less space compared to the event table.
For example, the event table, which contained 850,000 events, had a weight of 1.5 GB. The session table that was created based on these events had just 52,000 rows and its weight was 83 MB.

All visualization tools integrated with Google BigQuery perform an SQL query, as we mentioned in our first article here. By questioning a smaller table, visualizations work much faster and cheaper.
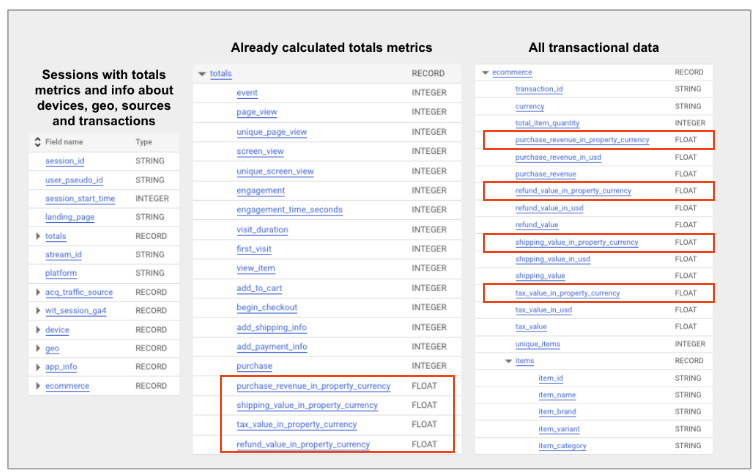
When preparing the session table, we thought about calculating the most popular metrics used for various reports and adding information about campaign sources, gellocations, devices or all transaction information. Therefore, what we obtain is a much lighter table, still very rich in information, without having to write additional SQL queries related to the event table.
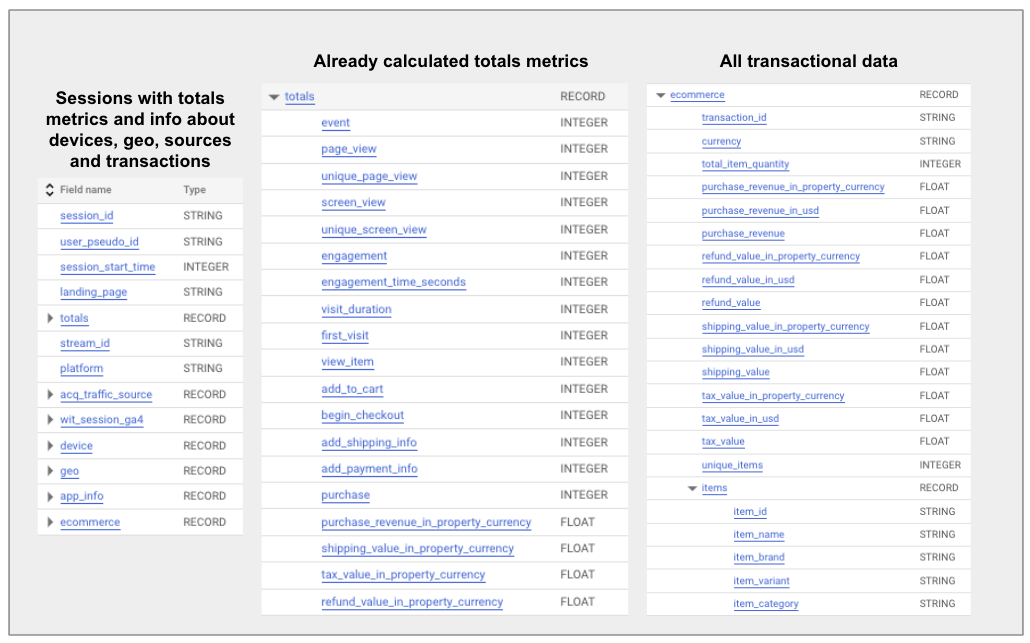
The module provides 3 session tables in the following models, i.e. Google Analytics 4, Universal Analytics Cross-Device and Universal Analytics Device
Based on the above-mentioned examples in the section on the "events" table, we already know that each model, i.e. Google Analytics 4, Universal Analytics Cross-Device and Universal Analytics Device will be able to have a different number of sessions and different traffic sources. Therefore, we decided to create 3 tables for particular models that have the same field scheme (metrics and dimensions).
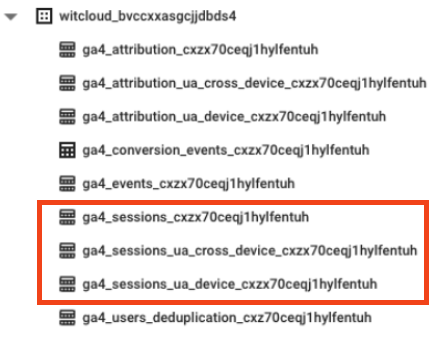
Session tables include currency conversions for stores selling in multiple markets
If users can make purchases in different currencies on our website or in the application, we must ensure that the value is converted to the currency that has been established in the settings of the respective service. This requires downloading the exchange rate from a given day through the API and creating additional calculation fields. That is why, we decided to make this task easier and automatically convert the values for transactions and products in our session table, according to the established currency in the Google Analytics 4 administrative settings.

Google Analytics 4 GA4 BigQuery - conversion attribution
Attribution of traffic sources in Google BigQuery
Owning Google Analytics 4 data in BigQuery, which was enriched with traffic sources in various models, we couldn't resist preparing some additional tables that contain the attribution of marketing channels. As in the case of the session table, we have included tables in 3 models here, i.e. Google Analytics 4 Cross Device, Google Analytics Universal Cross Device and Google Analytics Universal Device.
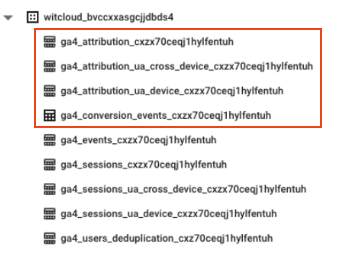
The attribution is performed for all events that have been marked as a conversion in the Google Analytics panel.

What do the attribution tables contain?
Attribution tables contain information about conversion paths in 5 different attribution models, i.e. last click non direct, first click, linear, position based and timedecay.
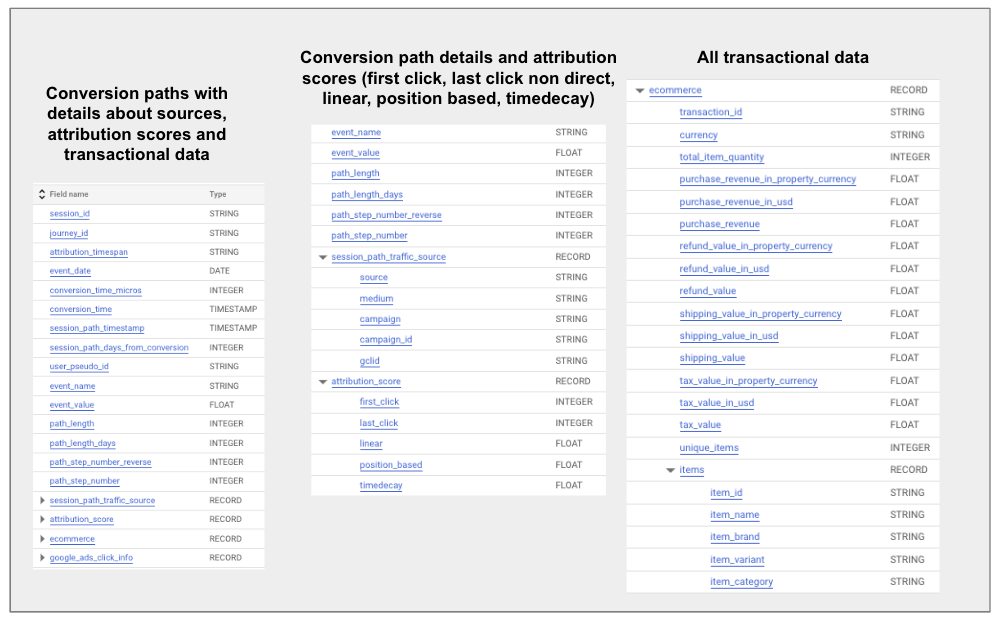
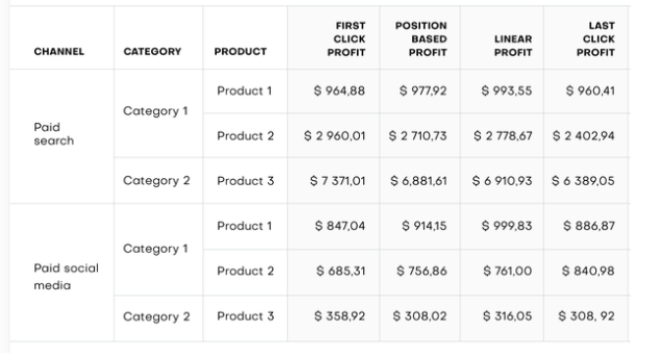
The data allows for a detailed analysis of all user paths leading to conversion. Having a calculated score for each model, we can multiply the weight (attribution_score) by the conversion value and obtain an accurate result for reporting purposes.

If our conversion is a “purchase” event, we will also find all information about transactions and sold products in the table. This gives us a lot of additional possibilities, e.g. we can data from CRM on profit based on transaction and product identifiers and check which marketing channels support particular product groups on the path to purchase.
Google Analytics 4 BigQuery module in WitCloud - start your analytical adventure in 30 minutes
Configuration of data export in Google BigQuery and creation of an account in WitCloud
You can start the adventure with the data described above in less than 30 minutes. All you need is a project on the Google Cloud Platform and a data export of Google Analytics 4 to BigQuery. If you create a Google Cloud Platform settlement account for the first time, you'll get $300 to use for the first 90 days
How to set up a project on Google Cloud Platform
How to start exporting Google Analytics 4 data to BigQuery
The next step is to create an account and project in the WitCloud platform. We offer a 14-day trial period. So taking into account $300 to get started with Google and our trial period, you can start data analysis for free.
How to set up a project on the WitCloud platform
Google Cloud Free Trial & WitCloud Free Trial'
How to set up a project on the WitCloud platform
The WitCloud platform can automatically download and process BigQuery data not only for Google Analytics 4, but also for popular advertising systems, e-commerce platforms, search console data and Google sheets.
In the first place, we recommend starting the following modules:
- Google Ads - to combine Google Ads campaign data with the GA4 module later
- Google Analytics 4 BigQuery
- in order to obtain the tables discussed in the article
It is recommended to configure other marketing sources at the next stage:
If you decide to give it a try and encounter any difficulties while activating the integration, do not hesitate to ask us a question via the chat located in the lower right corner of the website.

