# RFM report
# Introduction
If you run a sales-based business, this report is for you! This allows you to analyse the behaviour of your customers. You will see how much time has passed since the last purchase, how many times the recipient has made purchases and how much money they have left in your shop.
# What opportunities does this report offer you?
- Get to know groups of customers who spend on purchases
- You will find out how often a certain user has made purchases from you
- Find out which channel brings the most profits and find out where the advertising budget is best invested
- Transfer information about your customers to the advertising panel and improve the effectiveness of your ads
- Increase your e-commerce sales
- Check the effectiveness of your previous marketing activities
- A report with all the dates for the morning coffee
- Time savings due to automatic processes
- Transparent form of data presentation
- The ability to share with other colleagues in the organization
- Adding your own calculation fields
- You’ll see what you lose and what you gain
# What do you find in this report?
- Answers to important questions tailored to your company
- Useful business indicators include LTV and RFM
- Information on the current and historical performance of the company
- Information about user behaviour in different marketing channels
- Information on the effectiveness of marketing campaigns
Below you can see what your report might look like!
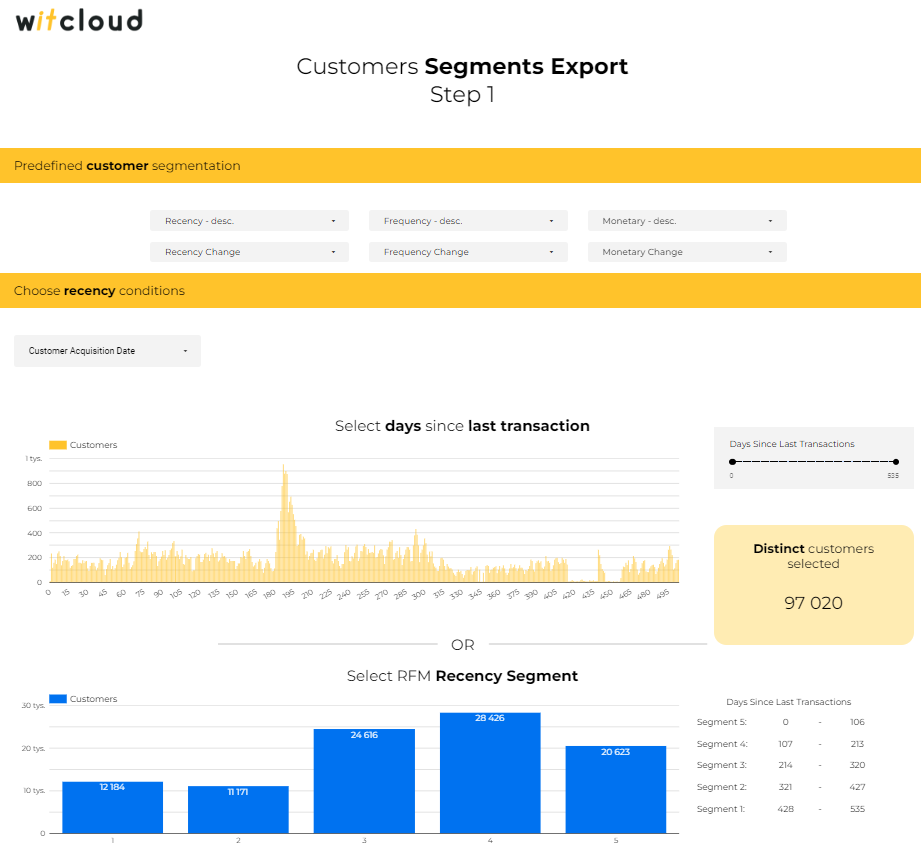
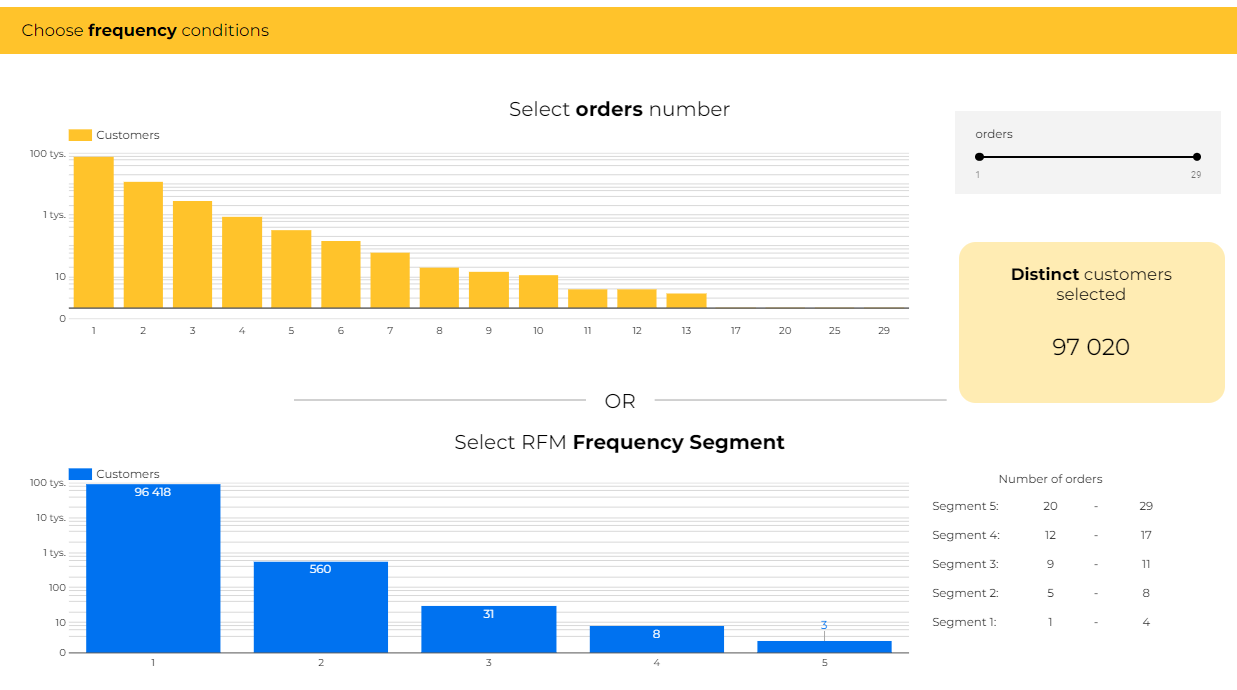
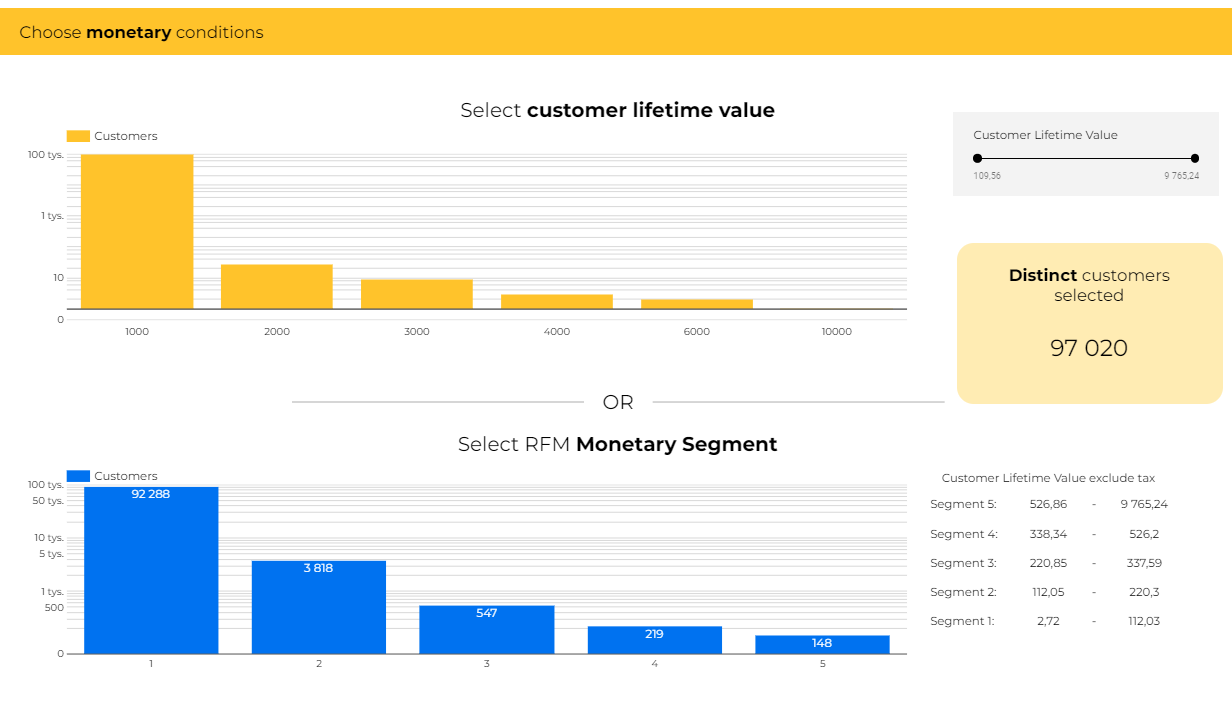
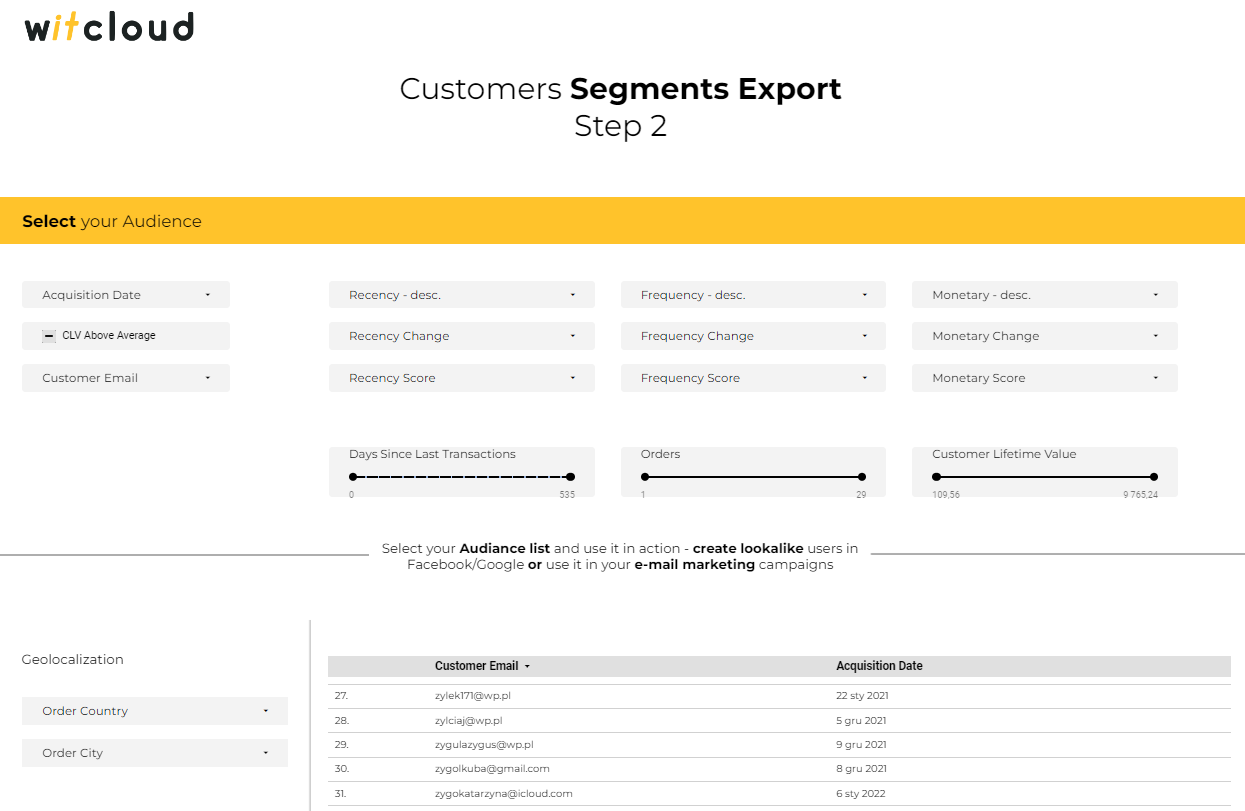
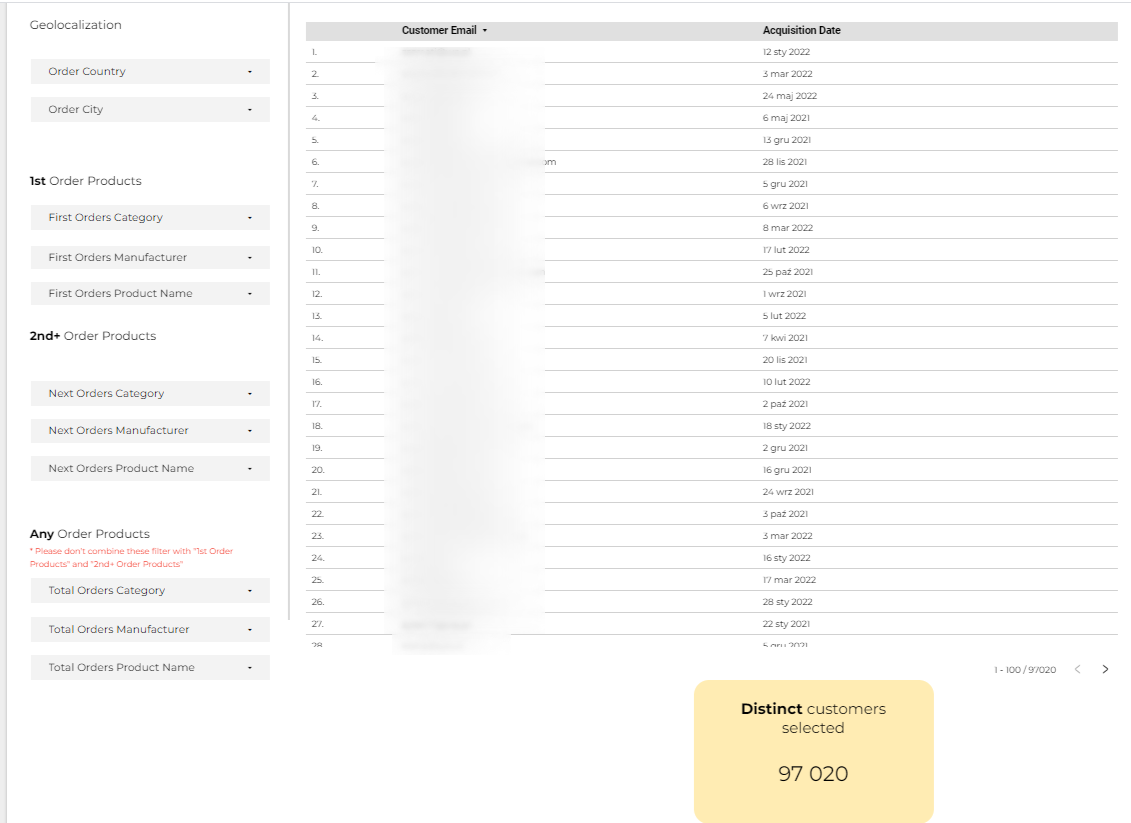
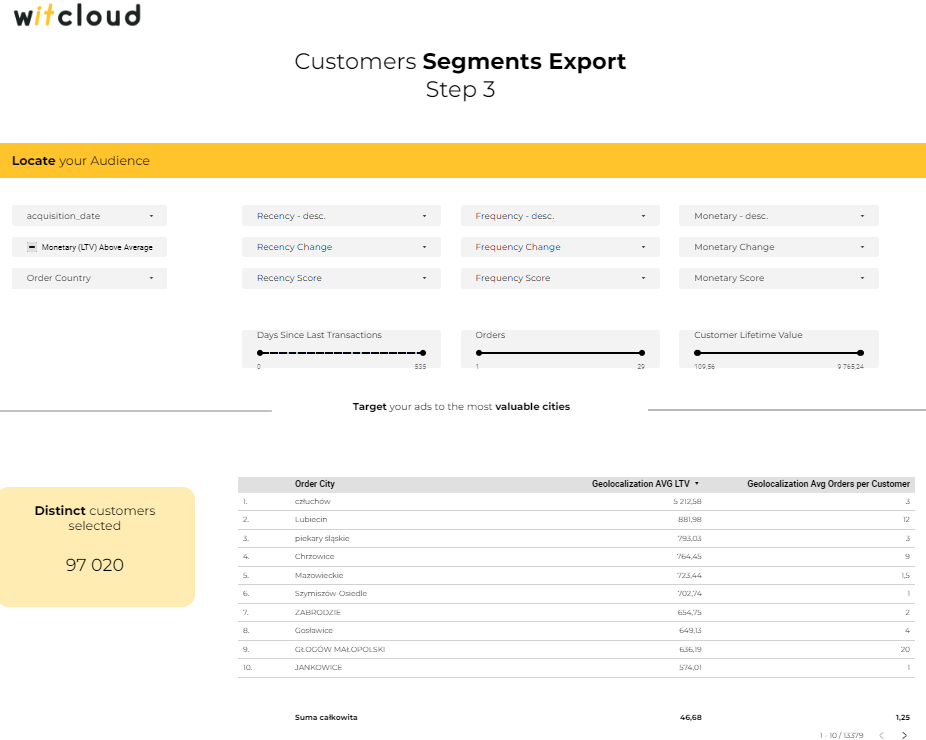
The report consists of three steps that allow you to analyze your recipient lists and export them to, for example, Facebook Ads or Google Ads. For a better understanding of the report, we have published a short documentation on the last page.
A preview of the visualization of the 3 steps.
To make it even easier for you to understand what options you have using our report and what you can find in it, we have prepared a detailed instruction manual with you in mind:
Demo Report (opens new window), which will allow you to test our report against the data you are interested in at a time you specify.
Blog link (opens new window) here you will find a detailed description of the report with examples and instructions on how to calculate the indicators of interest to you.
# List of necessary modules to create a report
Necessary to create a report:
- Baselinker link (opens new window) or Shoper link (opens new window) or Magento link (opens new window)
- List of calculated fields configured in the Data Studio template
Expand to see the data schema
| name | type | dataStudio/description |
|---|---|---|
| data_source_type | STRING | Type of data source e.g Ecommerce, Ad systems, User behaviour |
| data_source_subtype | STRING | Second type of data source e.g Magento, Analytics, Facebook, Tradedoubler |
| data_source_name | STRING | Name of your WitCloud resource |
| customer_id | STRING | Email hash |
| customer_email | STRING | Customer email adress |
| acquisition_date | STRING | Date of user acquisition |
| orders | INTEGER | Number of orders user made |
| first_order_revenue_incl_tax | FLOAT | First order revenue incl tax |
| next_orders_revenue_incl_tax | FLOAT | Next orders revenue incl tax |
| clv_include_tax | FLOAT | Client livetime value include tax |
| is_clv_include_tax_above_average | STRING | Information is users CLV is above average |
| clv_exclude_tax | FLOAT | Client livetime value exclude tax |
| aov | FLOAT | Average value of order |
| avg_days_between_orders | FLOAT | Average days between ordes |
| order_city | STRING | The city to which the order was sent |
| order_country | STRING | The country to which the order was sent |
| last_order_date | STRING | Last order date |
| days_since_last_transactions | INTEGER | Days since last transaction |
| rfm_segment_combination | STRING | RFM segment combination |
| recency | INTEGER | Recency score of users orders |
| frequency | INTEGER | Frequency score of users orders |
| monetary | INTEGER | Financial score of users orders |
| rfm_segment_name | STRING | RFM segment name |
| rfm_segment_description | STRING | RFM segment description |
| products_array_totals | STRING | Products client bought |
| products_array_first_orders | STRING | Products client bought in first order |
| products_array_next_orders | STRING | Products client bought in other then first orders |
| rfm_segment_combination_6m | STRING | RFM segment combination 6 months ago |
| recency_6m | INTEGER | Recency score of users orders 6 months ago |
| frequency_6m | INTEGER | Frequency score of users orders 6 months ago |
| monetary_6m | INTEGER | Financial score of users orders 6 months ago |
| rfm_segment_name_6m | STRING | RFM segment name 6 months ago |
| rfm_segment_description_6m | STRING | RFM segment description 6 months ago |
| currency | STRING | currency |
| acquisition_order_id | STRING | Acquisition Order Id |
| products_array_first_orders_name | STRING | First Orders Products Name |
| products_array_first_orders_category_ids | STRING | First Orders Products Category Ids |
| products_array_first_orders_manufacturer | STRING | First Orders Products Manufacturer |
| products_array_next_orders_name | STRING | Next Orders Products Name |
| products_array_next_orders_category_ids | STRING | Next Orders Products Category Ids |
| products_array_next_orders_manufacturer | STRING | Next Orders Products Manufacturer |
| products_array_total_orders_name | STRING | Total Orders Products Name |
| products_array_total_orders_category_ids | STRING | Total Orders Products Category Ids |
| products_array_total_orders_manufacturer | STRING | Total Orders Products Manufacturer |
- List of calculated fields configured in the Data Studio template
Expand for the data schema
| ID | NAME | TYPE | FORMULA | DESCRIPTION |
|---|---|---|---|---|
| CLV - Chart | CLV - Chart | NUMBER | CEIL(clv_exclude_tax/1000)*1000 | Field of work |
| Frequency - desc. | Frequency - desc. | TEXT | case when frequency = 5 then "High frequency - placed many orders" when frequency = 4 or frequency = 3 or frequency = 2 then "Medium frequency - placed medium ammount of orders" when frequency = 1 then "Low frequency - placed few orders" END | Descriptive frequency valuei |
| Frequency Change | Frequency Change | TEXT | case when frequency > frequency_6m then "Increasing" when frequency = frequency_6m then "Constant" when frequency < frequency_6m then "Decreasing" when frequency_6m is null then "New Customers" END | Frequency change in a defined time |
| Monetary - desc. | Monetary - desc. | TEXT | case when monetary = 5 then "High Monetary - spend a lot of money" when monetary = 4 or monetary = 3 or monetary = 2 then "Medium Monetary - spend medium ammount of money" when monetary = 1 then "Low Monetary - spend least money" END | Descriptive value of user outputs |
| Monetary Change | Monetary Change | TEXT | case when monetary > monetary_6m then "Increasing" when monetary = monetary_6m then "Constant" when monetary < monetary_6m then "Decreasing" when monetary_6m is null then "New Customer" END | Change the value of your expenses over a certain period of time |
| Recency - desc. | Recency - desc. | TEXT | case when recency = 5 then "High Recency - bought recently" when recency = 4 or recency = 3 or recency = 2 then "Medium Recency - bought in medium time range" when recency = 1 then "Low Recency - bought long time ago" END | Time since last purchase |
| Recency Change | Recency Change | TEXT | case when recency>recency_6m then "Increasing" when recency=recency_6m then "Constant" when recency<recency_6m then "Decreasing" when recency_6m is null then "New Customer" END | Change in customer behaviour over time |
| Geolocalization AVG LTV | Geolocalization AVG LTV | TEXT | sum(clv_exclude_tax)/COUNT_DISTINCT(customer_id) | Average LTV per city |
| Geolocalization Avg Orders per Customer | Geolocalization Avg Orders per Customer | TEXT | sum(orders)/ count_distinct(customer_id) | Average LTV value of a user in a city |
| Monetary Chart Field | Monetary Chart Field | TEXT | case when COUNT_DISTINCT(customer_email) is null then 0 else COUNT_DISTINCT(customer_email) end | Field of work |
| Orders Calc | Orders Calc | TEXT | sum(orders)/if (COUNT(customer_id)=count_distinct(customer_id),1,COUNT(customer_id)) | Field of work |
:::
# Instructions for configuring the report
To create a report, you must first:
- Register on our platform Witcloud (opens new window)
TIP
If you don’t have a WitCloud account yet or need information on how to log in, you can find the instructions here (opens new window).
- After logging in, select the button Smart Data in the left pane.
- Select Reports from the drop-down list. You will be taken to a section where you can create a new report.
- To do so, click on the button “Add new report” at the top left, which will take you to a page with a list of available reports. Select the report RFM
- To create your report, you must have created the necessary Collect and then click on the “Create your own report” button. If you receive the following message, you have not set up the required collectu. You have to create it.

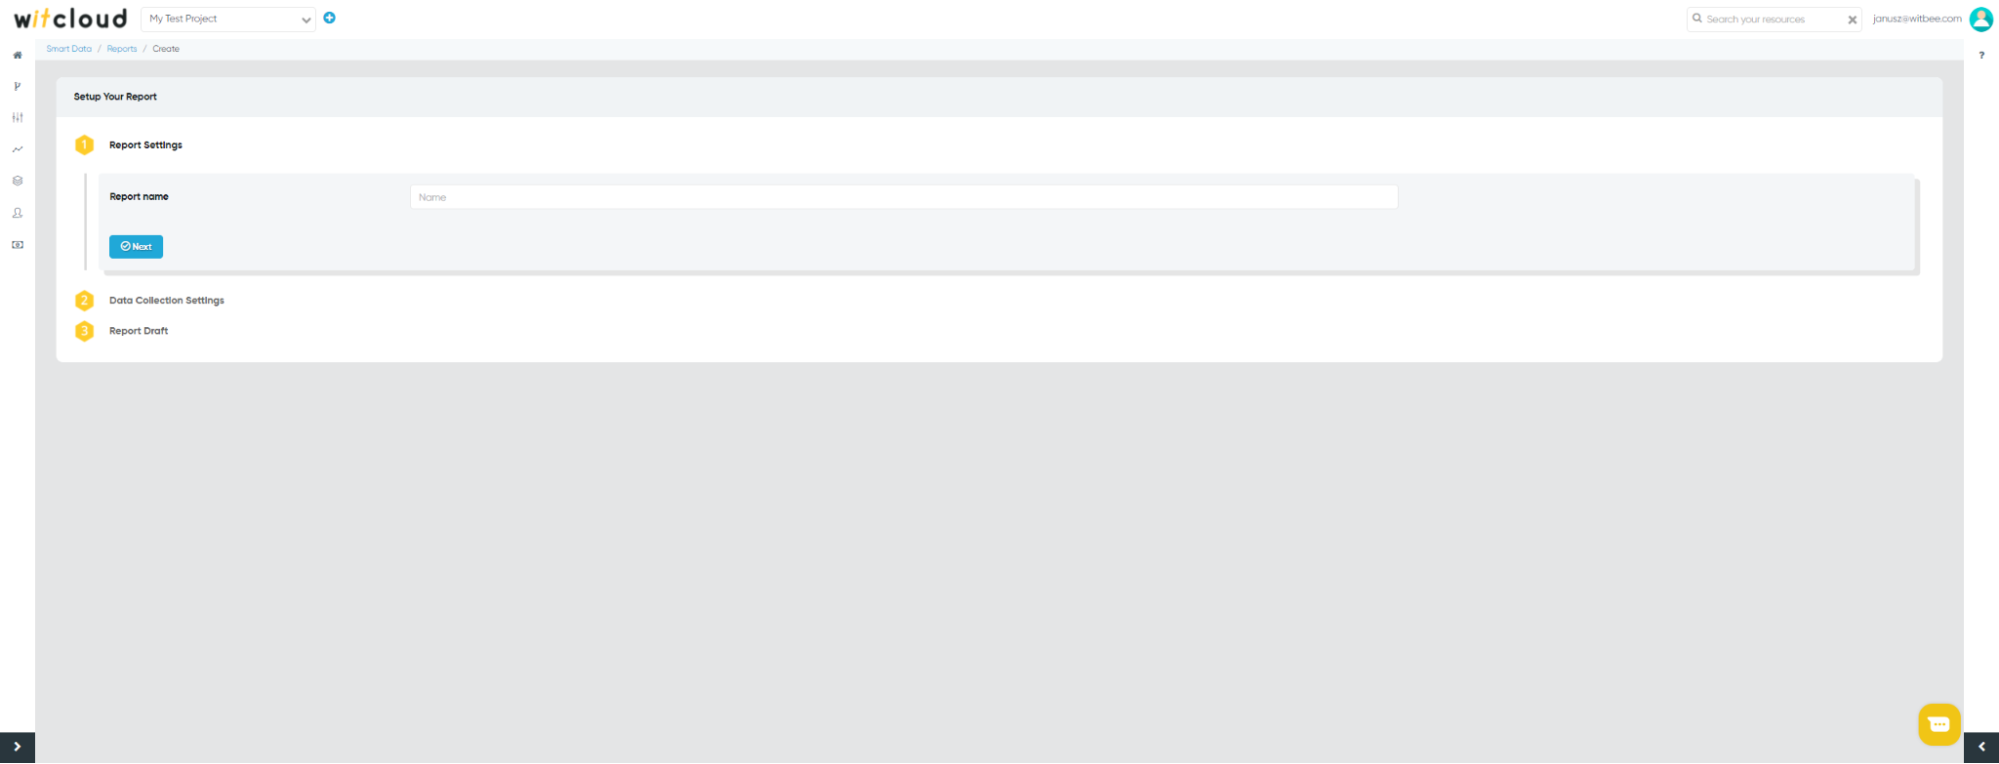
In the next step, you will be taken to a section where the following fields are required to be completed:
Report name - under this name you will find your report in our platform.
After filling in the above fields, click on the Next button

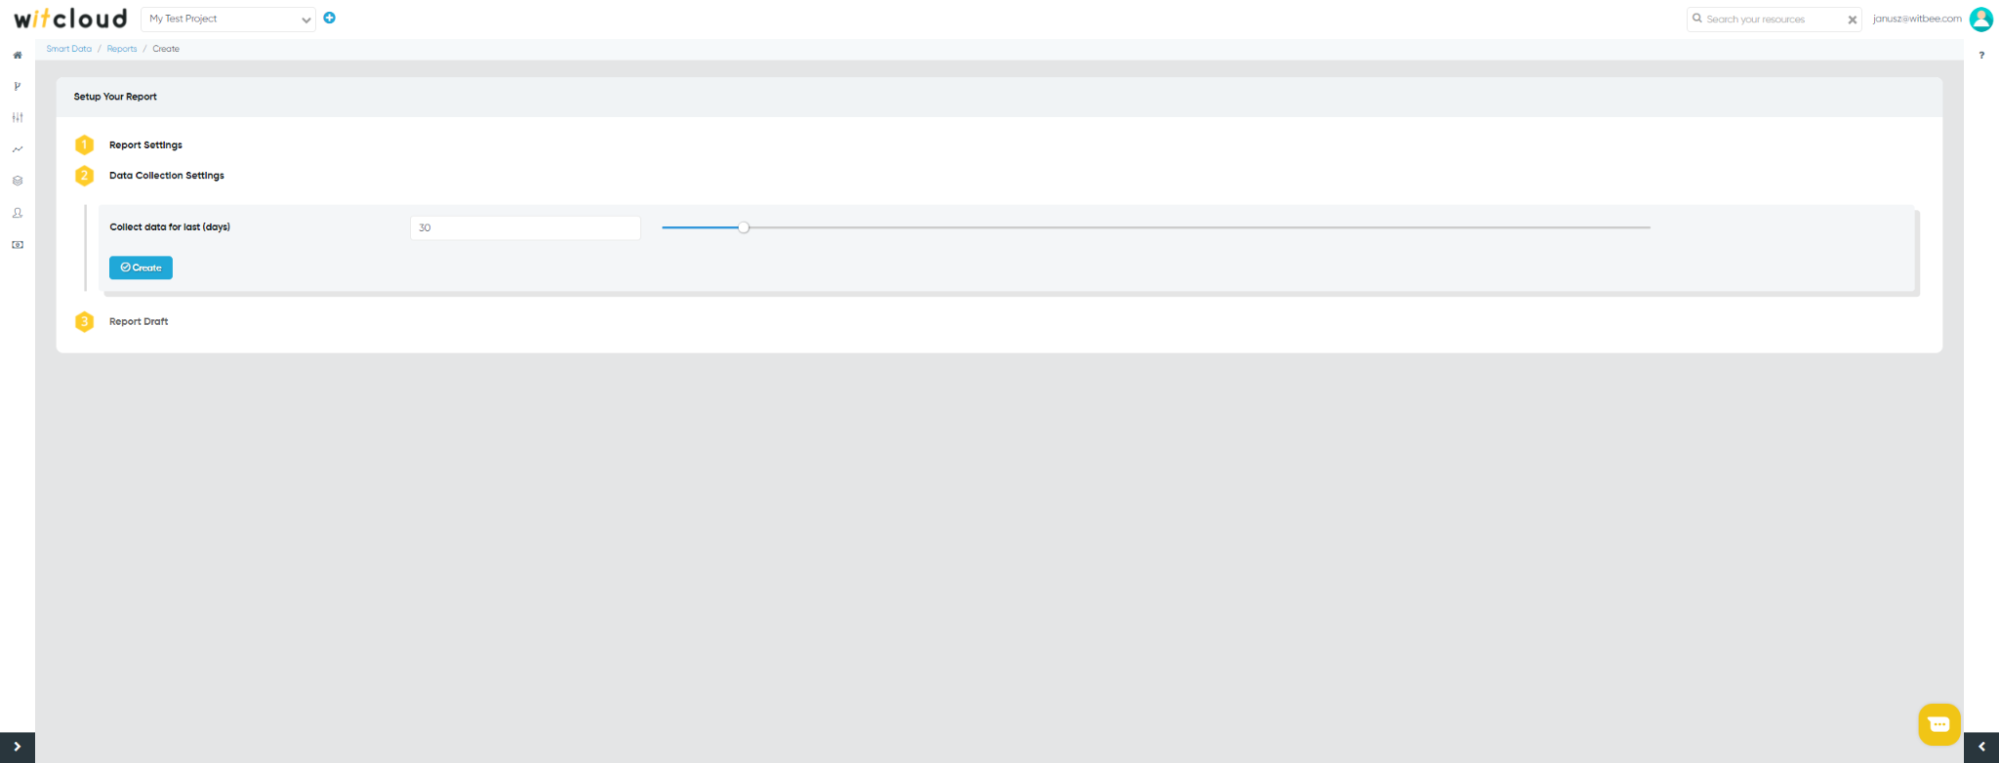
In the next step, you specify the period for which the historical data should be downloaded. Click on the “create” button to complete the creation of your report.

# Visualization
To get the visualization of the data in our proposed Data Studio tool, select the button “Link to template” in the Report Draft section, which will take you to the Studio date where you need to enter your login data for Witcloud.
The first step is to select your project Witcloud.
After clicking on “Next”, select your report.
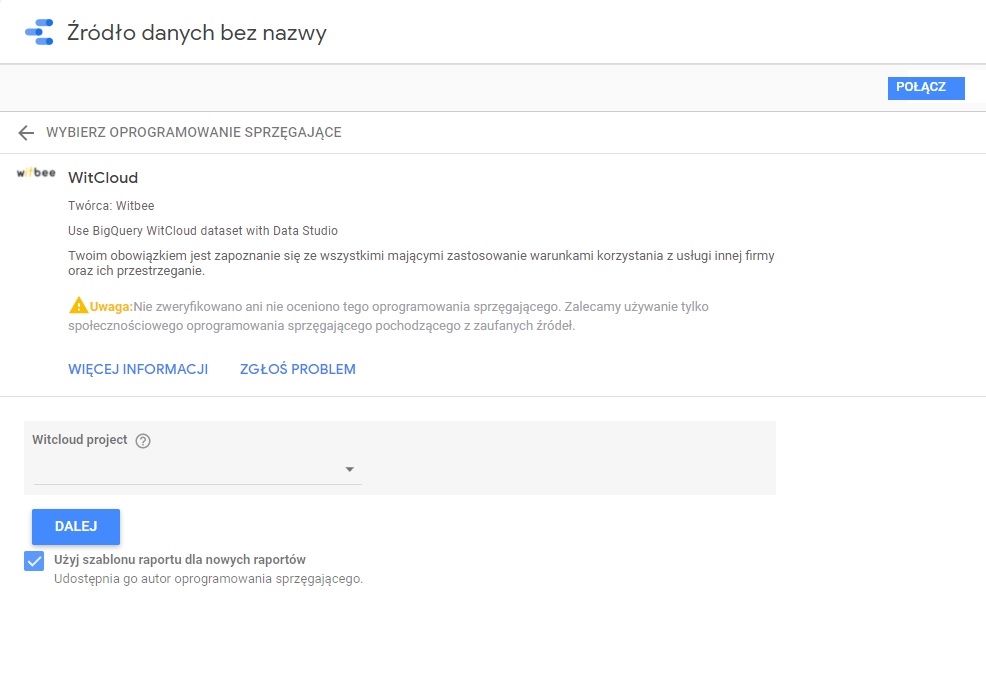
To complete the configuration of the data visualization in the upper right corner, click the “Connect” button and then “Create Report” button. The data for the period you set is loaded into a table in BigQuery, which is updated every hour. Read more about this in the [Autoworkflow] section.
If you want to visualize the collected data in a tool other than Data Studio, you have the option. You can do this with a program of your choice, provided it connects to BigQuery. To do this, select the “Link to table” button in the Draft Report section, which will take you to the table in BigQuery.