# Ecommerce customers report
# Introduction
If you run a sales-based business, this report is for you! This allows you to analyze customer behavior on your website or app.
# What opportunities does this report offer you?
- Possibility to obtain data on the status of orders
- Ability to combine 100% operational data with marketing cost data
- A report with all the dates for the morning coffee
- Time savings due to automatic processes
- Transparent form of data presentation
- We automatically convert currencies from different accounts to a common currency
- The ability to share with other colleagues in the organization
- Adding your own calculation fields
- You’ll see what you lose and what you gain
# What do you find in this report?
- Answers to important questions tailored to your company
- Useful business indicators include ERS, ROAS
- Information on the current and historical performance of the company
- Information about user behaviour in different marketing channels
- Information on the effectiveness of marketing campaigns
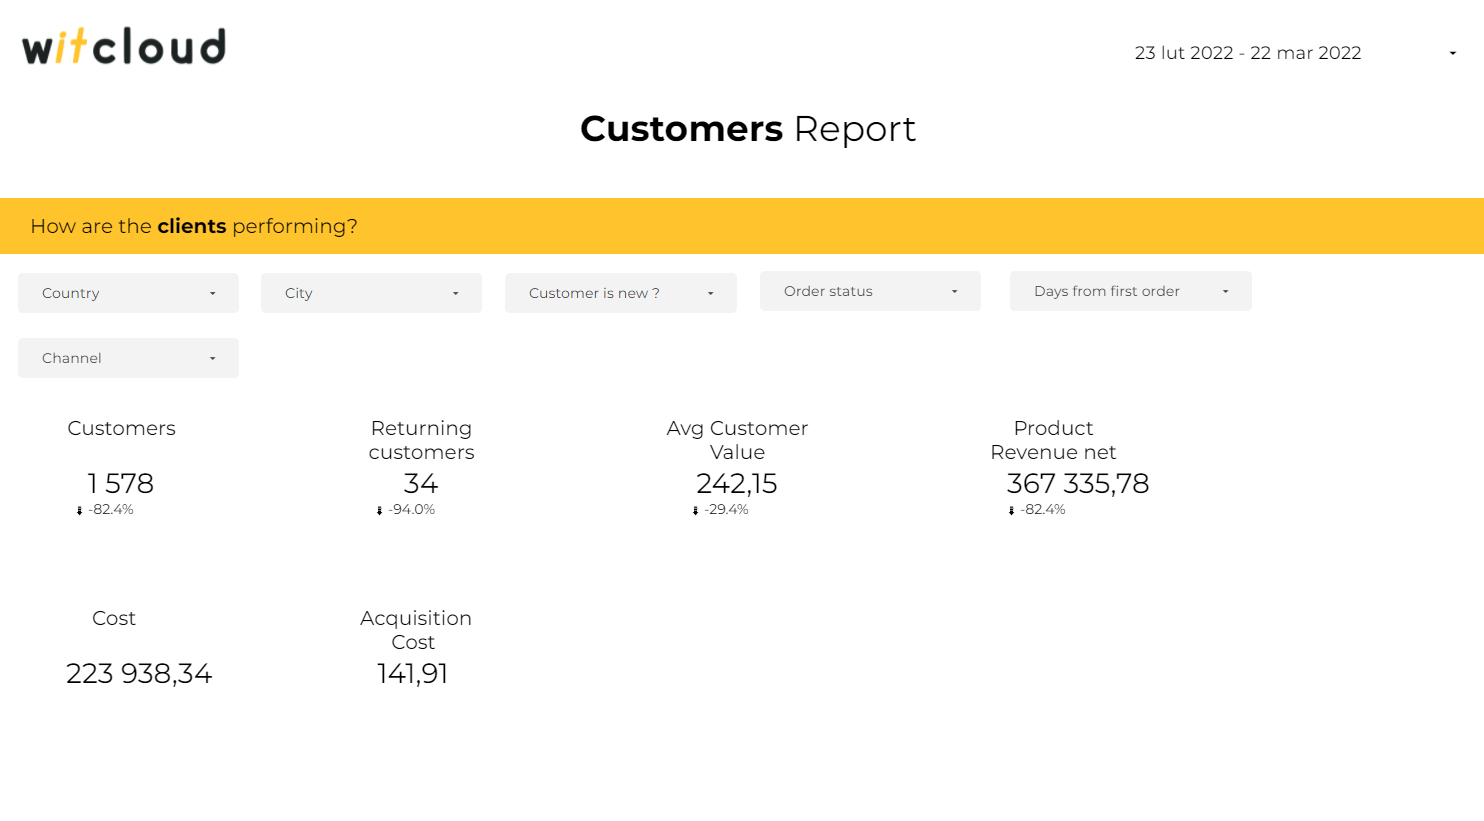
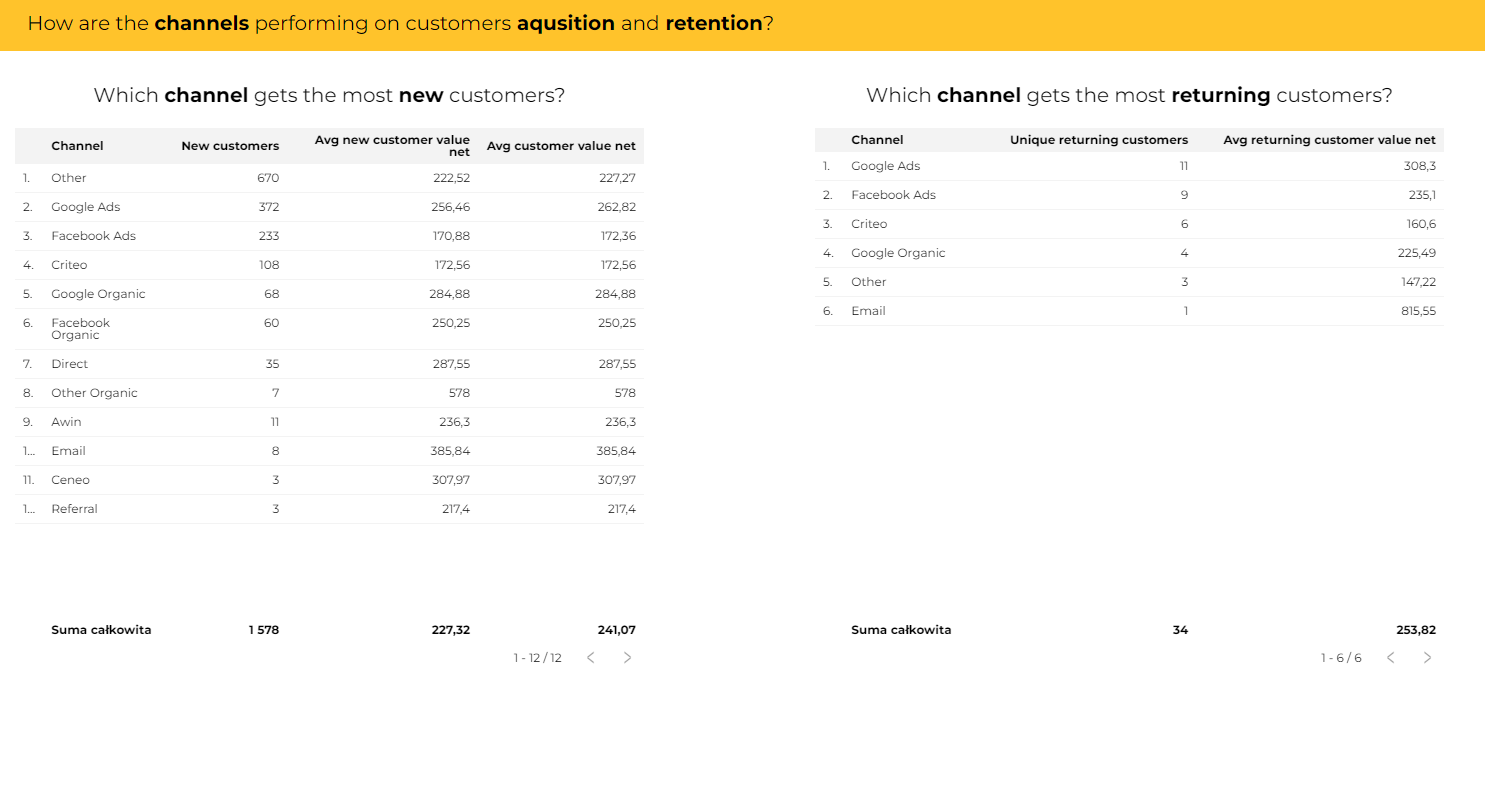
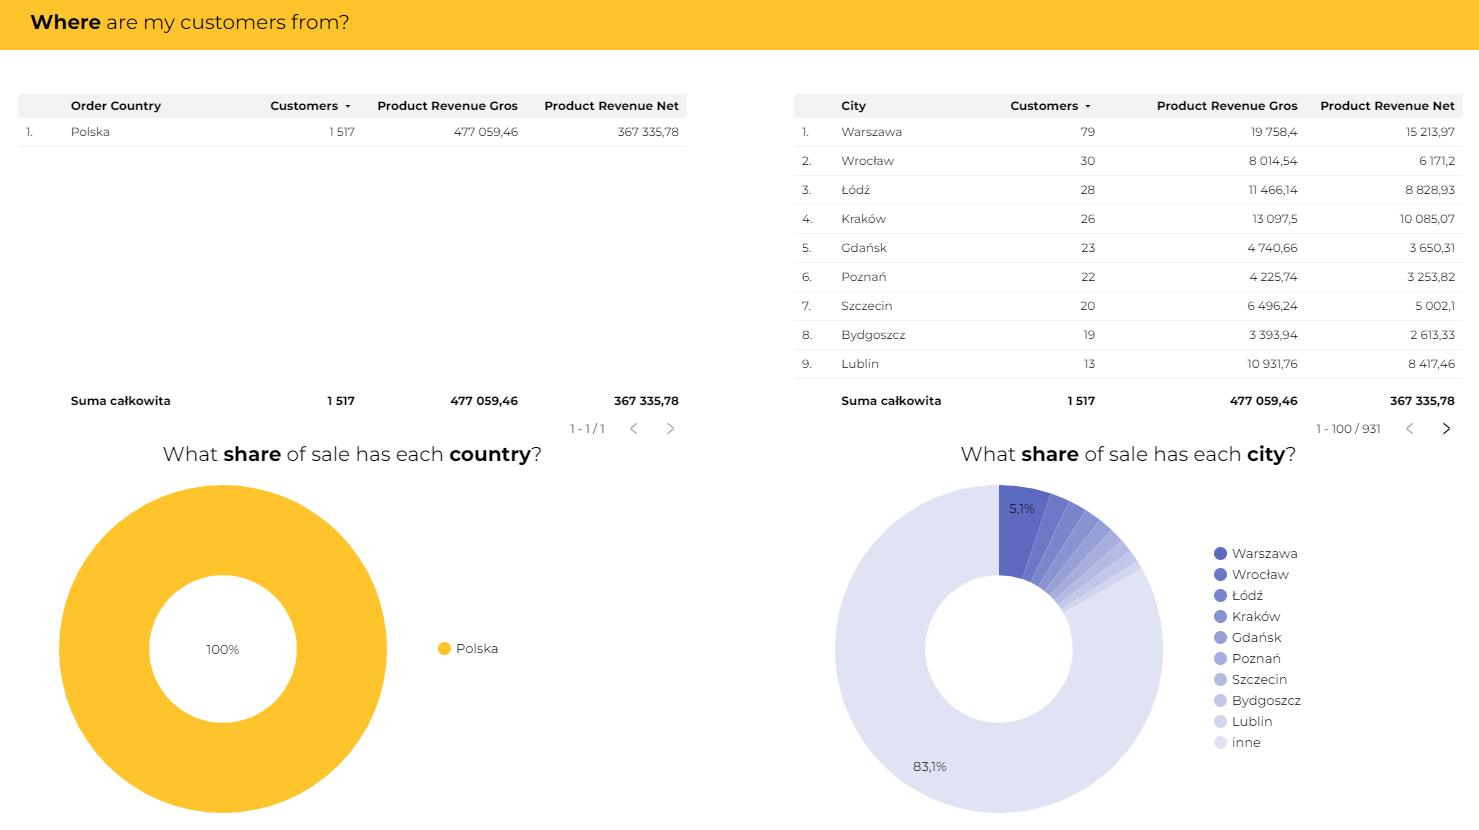
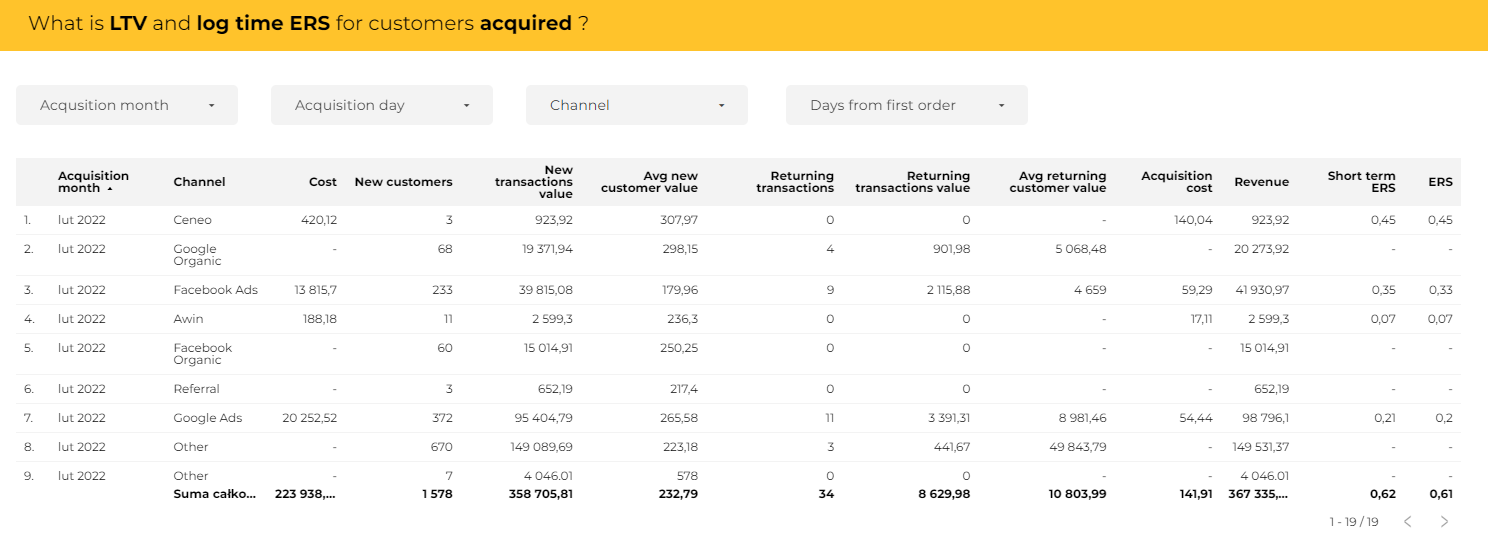
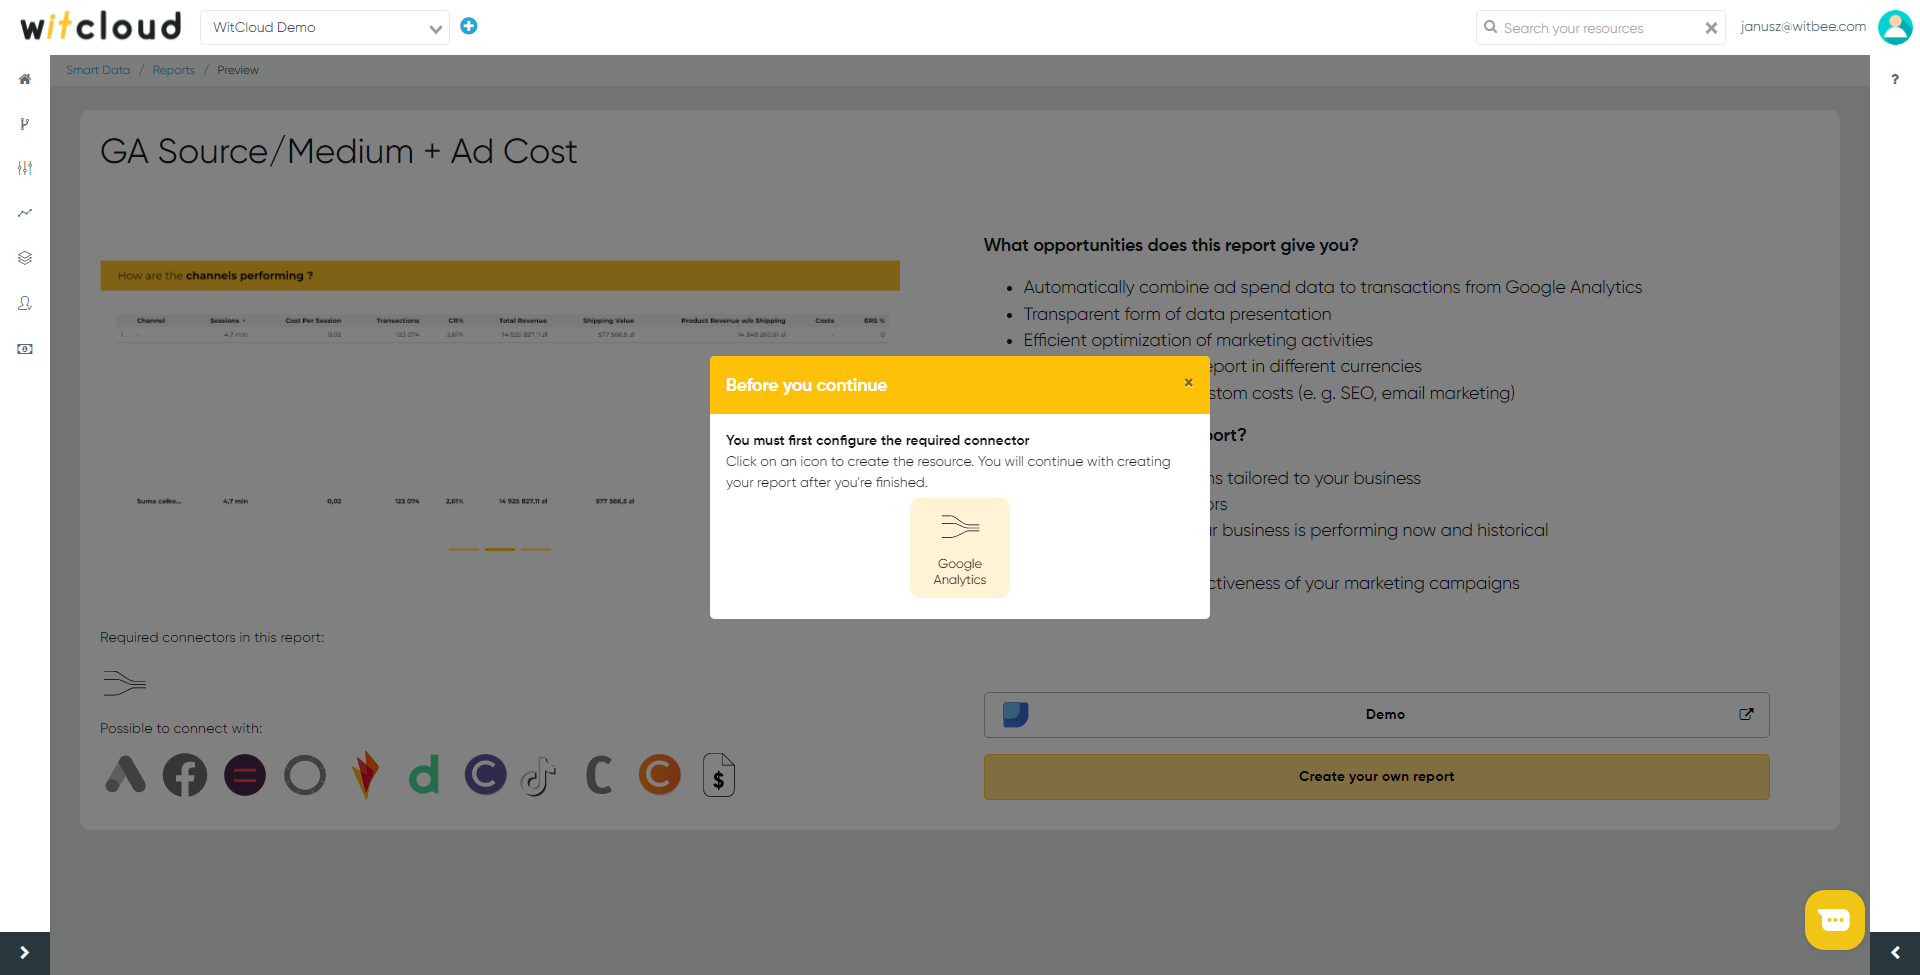
Below you can see what your report might look like!
To make it even easier for you to understand what your options are with our report and what you can find in it, we've put together a detailed tutorial with you in mind:
Demo Report (opens new window) which will allow you to test our report against the data you are interested in at a time you specify.
Blog (opens new window) here you will find a detailed description of the report along with examples and instructions on how to calculate the metrics you are interested in.
# List of necessary and optional modules to create a report
Necessary to create a report:
- Baselinker link (opens new window) or Shoper link (opens new window) or Magento link (opens new window)
Optional Module:
- Google Analytics link (opens new window) or WitCloud Stream
- Google analytics 360 link (opens new window)
- Google Ads Link (opens new window)
- Facebook Ads Link (opens new window)
- RTB House Link (opens new window)
- Optimize link (opens new window)
- Awin link (opens new window)
- Domodi & Allani Link (opens new window)
- Convert link (opens new window)
- TikTok Link (opens new window)
- Ceneo Link (opens new window)
- Criteus Link (opens new window)
- Custom Data Link (opens new window)
- TradeDoubler Link (opens new window)
# Data schema
- List of metrics and dimensions in the table
Hide out for the data schema
| name | type | dataStudio/description |
|---|---|---|
| data_source_type | STRING | Type of data source e.g Ecommerce, Ad systems, User behaviour |
| data_source_subtype | STRING | Second type of data source e.g Magento, Analytics, Facebook, Tradedoubler |
| data_source_name | STRING | Name of your WitCloud resource |
| date | STRING | Date |
| order_id | STRING | Order id |
| order_date | STRING | Date of transaction |
| order_status | STRING | Order status description |
| order_delivery_name | STRING | Name of the courier company |
| order_payment_name | STRING | Name of the payment method |
| order_city | STRING | The city to which the order was sent |
| order_region | STRING | The region to which the order was sent |
| order_country | STRING | The country to which the order was sent |
| customer_email | STRING | Customer e-mail address |
| customer_is_new | INTEGER | The value of this field tells us if it is the first order placed by the customer |
| product_quantity | INTEGER | Number of units sold in transactions |
| product_revenue_incl_tax | FLOAT | Total revenue from transactions - this field include tax |
| product_revenue_excl_tax | FLOAT | Total revenue from transactions - this field do not include tax |
| shipping_revenue_incl_tax | FLOAT | Total shipping charges for transactions - this field include tax |
| shipping_revenue_excl_tax | FLOAT | Total shipping charges for transactions - this field do not include tax |
| discount_value_incl_tax | FLOAT | Total discount value for transactions - this field include tax |
| discount_value_excl_tax | FLOAT | Total discount value for transactions - this field do not include tax |
| ga_sessions | INTEGER | Count of Google Analytics Sessions |
| ga_revenue | FLOAT | Amount of Google Analytics Sessions |
| channel | STRING | Rule-based groupings of your traffic sources |
| source | STRING | Analytics source |
| medium | STRING | Analytics medium |
| campaign | STRING | Analytics campaign |
| ad_content | STRING | Analytics ad content |
| keyword | STRING | Analytics keyword |
| costs | FLOAT | Ad systems cost |
| original_costs | FLOAT | Ad system cost before currency conversion |
| clicks | INTEGER | Ad systems clicks |
| impressions | INTEGER | Ad systems impressions |
| ad_system_conversions | FLOAT | Ad system conversions |
| ad_system_conversion_value | FLOAT | Ad system conversion value |
| original_ad_system_conversion_value | FLOAT | Ad system conversion value before currency conversion |
| account_id | STRING | Ad system account id |
| account_name | STRING | Ad system account name |
| campaign_id | STRING | Ad system campaign id |
| campaign_name | STRING | Ad system campaign name |
| ad_id | STRING | Ad system ad id |
| ad_name | STRING | Ad system ad name |
| publisher_id | STRING | Ad system publisher id |
| publisher_name | STRING | Ad system publisher name |
| placement | STRING | Ad system placement |
| currency | STRING | Currency |
| report_currency | STRING | Report currency |
- List of calculation fields configured in the Data Studio template
Hide out for the data schema
| ID | NAME | TYPE | FORMULA | DESCRIPTION |
|---|---|---|---|---|
| acqusition_cost | Acqusition cost | NUMBER | SUM(costs) / SUM(customer_is_new) | Cost of new customer |
| aov_orders | AOV Orders | NUMBER | SUM(product_revenue_excl_tax) / COUNT_DISTINCT(order_id) | Avg order revenue net |
| cost_per_order | CPO | NUMBER | SUM(cost) / COUNT_DISTINCT(order_id) | Cost of order |
| ers_netto | ERS net | PERCENT | sum(cost)/sum(product_revenue_excl_tax) | ERS net |
| ga_conversion_rate | Conversion Rate | PERCENT | COUNT_DISTINCT(order_id) / SUM(ga_sessions) | Conversion rate |
| new_orders_rate | New Orders Rate | PERCENT | SUM(customer_is_new) / COUNT_DISTINCT(order_id) | New orders in all orders rate |
| new_orders_share | New Orders Share | PERCENT | SUM(customer_is_new) / COUNT_DISTINCT(order_id) | New orders in all orders share |
| orders | Orders | NUMBER | COUNT_DISTINCT(order_id) | Orders count |
| city_upper | City Upper | TEXT | UPPER(order_city) | City in uppercase |
| is_new_label | Customer is new? | TEXT | CASE WHEN customer_is_new = 1 THEN "new" WHEN customer_is_new = 0 THEN "returning" END | "new" or "returning" |
| returning_customers | Customer is returning | NUMBER | IF(customer_is_new = 0, 1, 0) | 1 if customer is returning |
| returning_orders_share | Returning orders share | PERCENT | SUM(IF(customer_is_new= 0, 1, 0)) / COUNT_DISTINCT(order_id) | Returning orders in all orders share |
| roas_netto | ROAS netto | PERCENT | SUM(product_revenue_excl_tax) / sum(cost) | ROAS net |
| is_in_google_analytics | Is in Google Analytics? | TEXT | IF(Channel Grouping = 'Adblock - CRM only', 'Not Found Transaction in Google Analytics', 'Transactions in Google analytics') | Is transaction in Google Analytics ? |
:::
# Instructions for configuring the report
To create a report, you must first:
- Register on our platform Witcloud (opens new window)
TIP
If you don’t have a WitCloud account yet or need information on how to log in, you can find the instructions here (opens new window).
- After logging in, select the button Smart Data in the left pane.
- Select Reports from the drop-down list. You will be taken to a section where you can create a new report.
- To do so, click on the button “Add new report” at the top left, which will take you to a page with a list of available reports. Select the report Ecommerce customers
- To create your report, you must have created the necessary Collect and then click on the “Create your own report” button. If you receive the following message, you have not set up the required collectu. You have to create it.
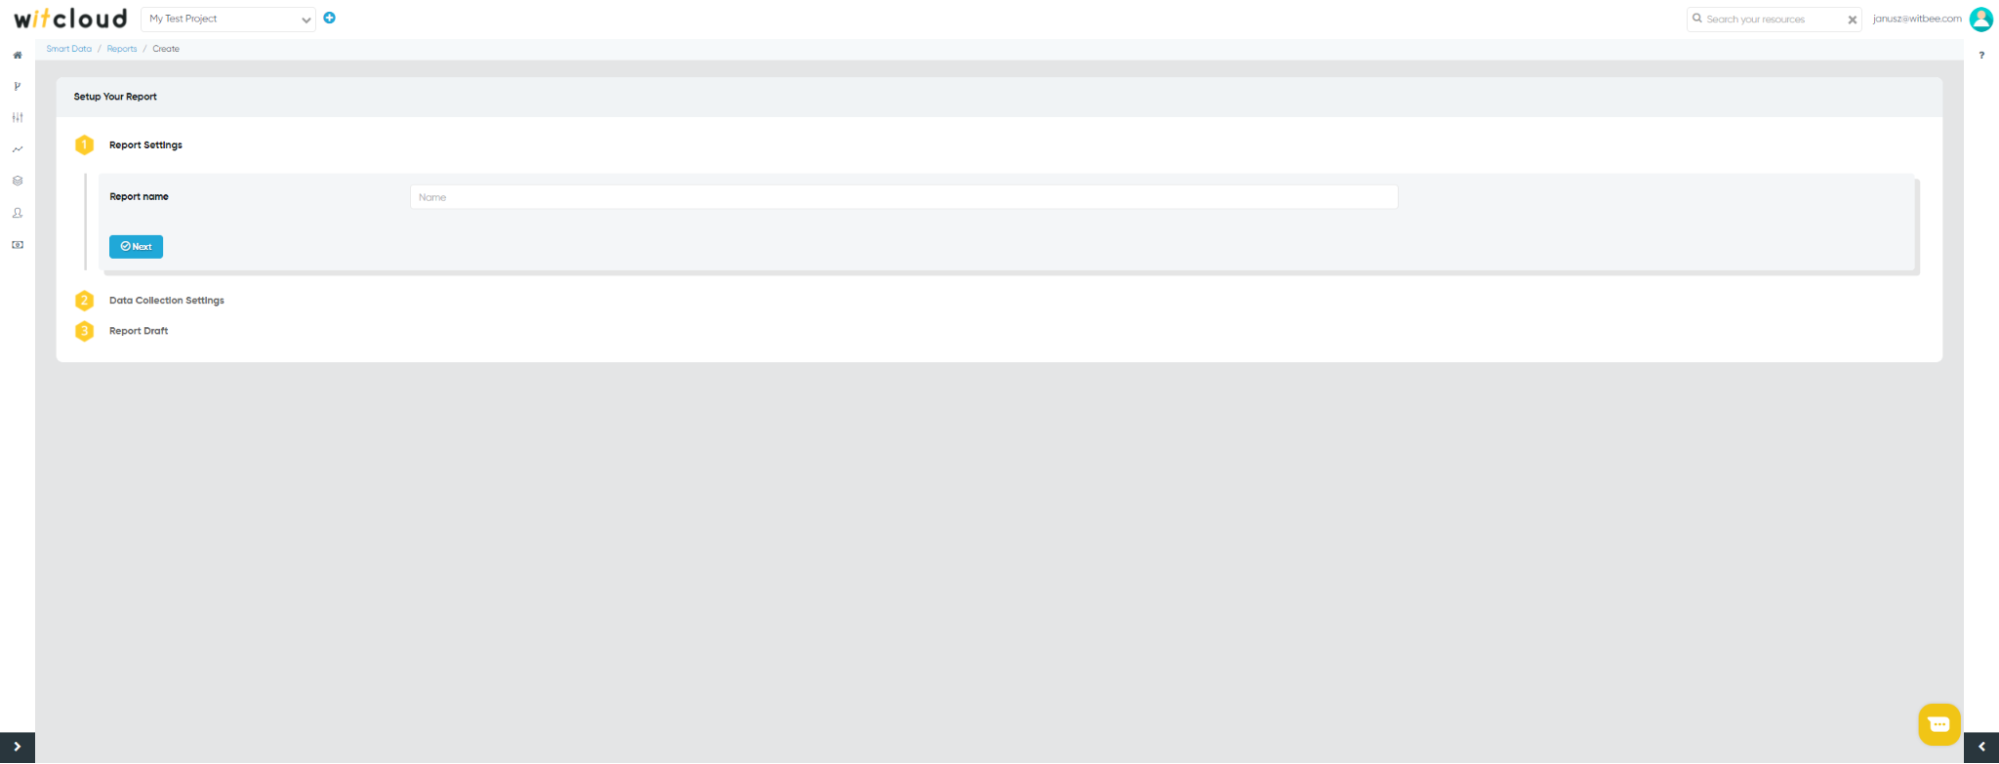
In the next step, you will be taken to a section where the following fields are required to be completed:
Report name - under this name you will find your report in our platform.
After filling in the above fields, click on the Next button
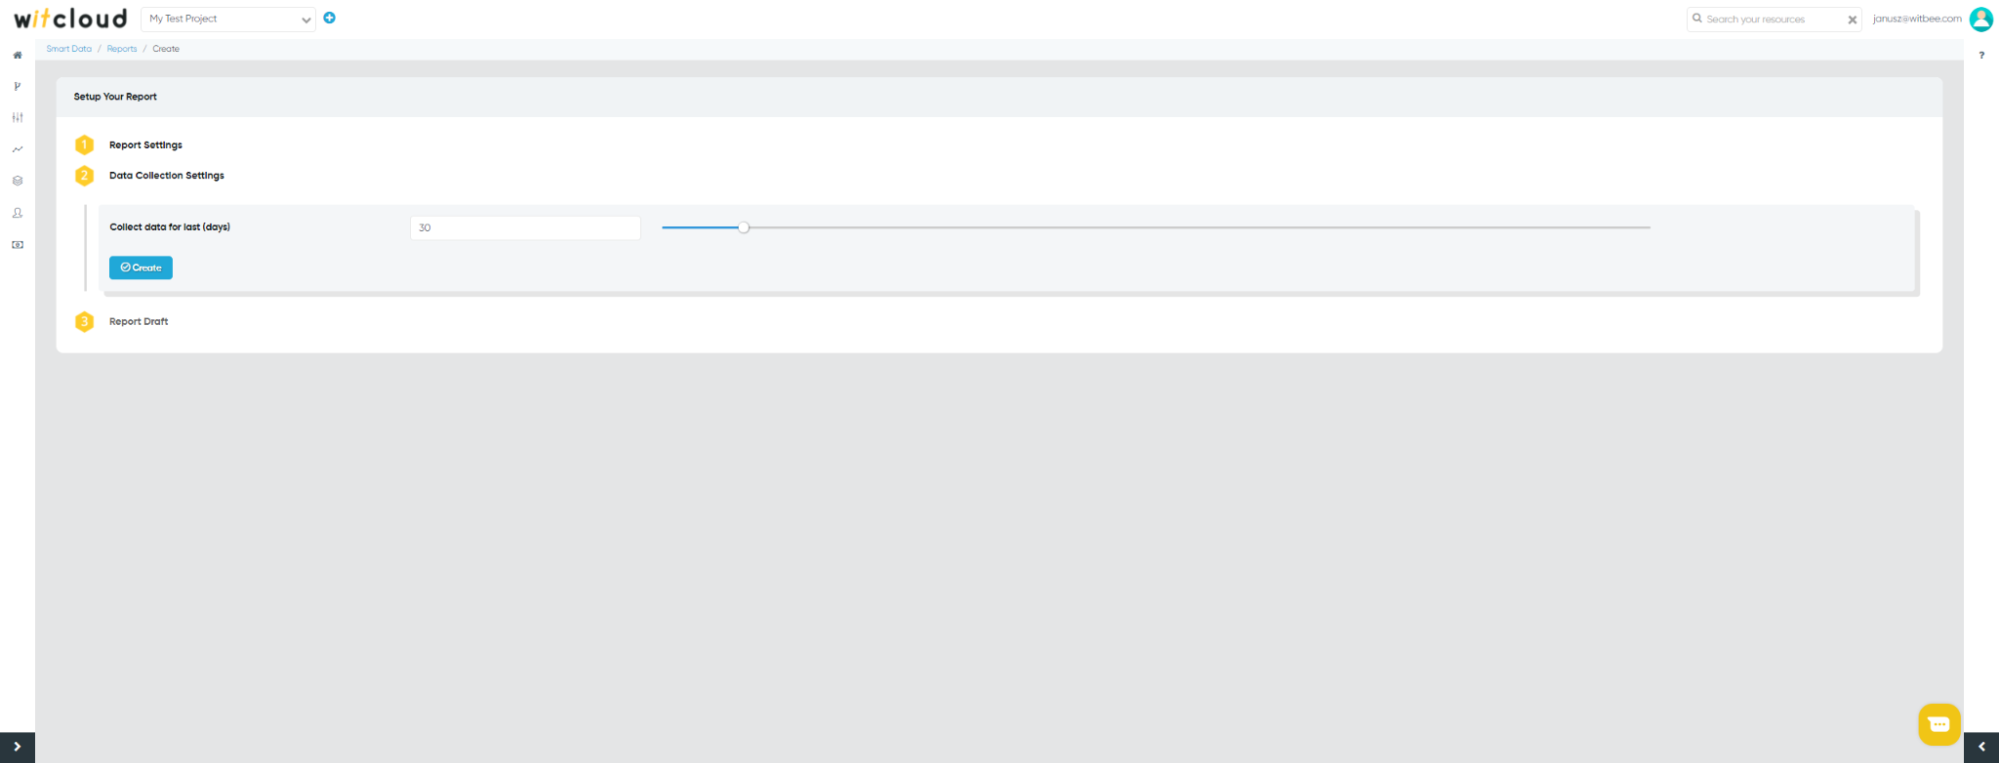
In the next step, you specify the period for which the historical data should be downloaded. Click on the “create” button to complete the creation of your report.
# Visualization
To get the visualization of the data in our proposed Data Studio tool, select the button “Link to template” in the Report Draft section, which will take you to the Studio date where you need to enter your login data for Witcloud.
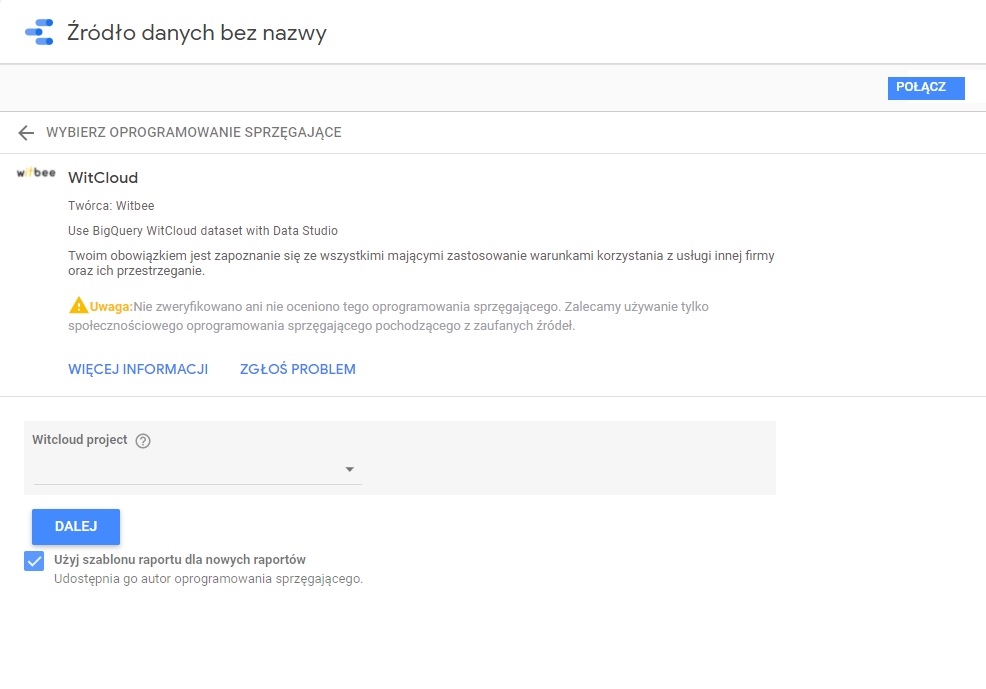
The first step is to select your project Witcloud.

After clicking on “Next”, select your report.

To complete the configuration of the data visualization in the upper right corner, click the “Connect” button and then “Create Report” button. The data for the period you set is loaded into a table in BigQuery, which is updated every hour. Read more about this in the [Autoworkflow] section.
If you want to visualize the collected data in a tool other than Data Studio, you have the option. You can do this with a program of your choice, provided it connects to BigQuery. To do this, select the “Link to table” button in the Draft Report section, which will take you to the table in BigQuery.