
Data monitoring
Check whether your integrations run and succeed, and how much data WitCloud processes for the project.
Updated
Data monitoring shows, for the current project, whether your integrations run and succeed, and how much data WitCloud processes for them.
Where to find it
Go to Admin settings > Data monitoring.
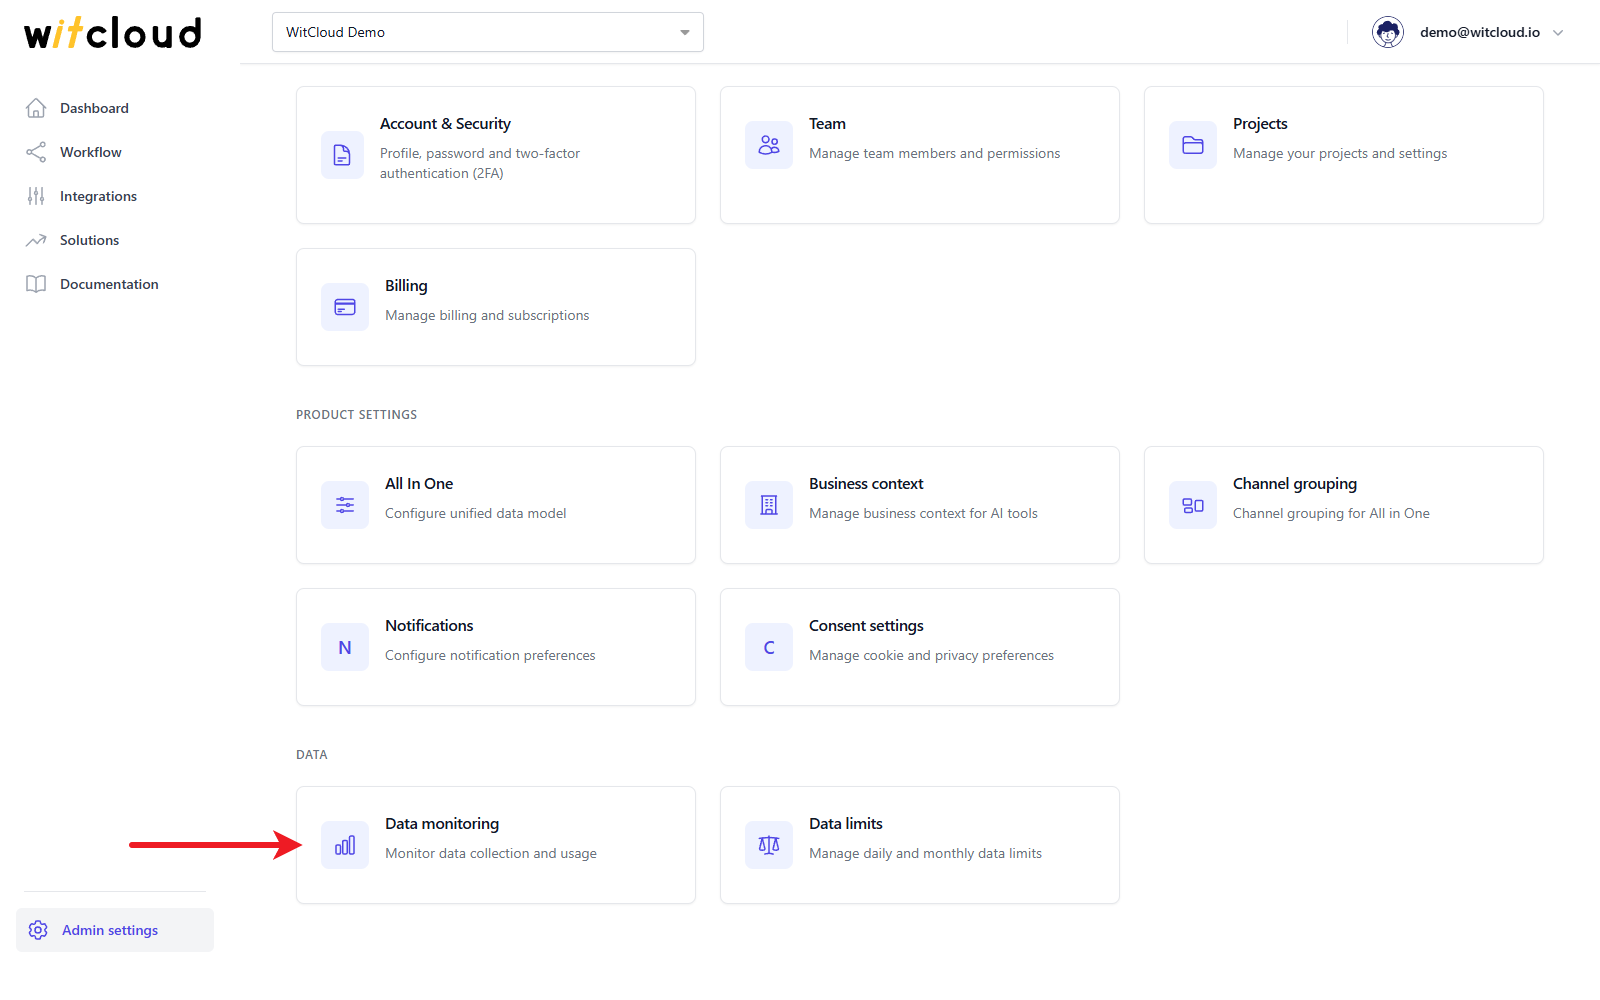
Everyone in the project can open it.
Integration health
The table at the top lists your integrations with:
- Last Run — when the integration last ran.
- Runs (30d) — one square per day for the last 30 days, oldest on the left: green when all runs that day succeeded, amber when some failed, red when all failed, gray when there was no run. Hover a square to see the day's runs; the caption shows how many runs succeeded out of all runs.
- Status — the health of the integration. Hover it to see why.
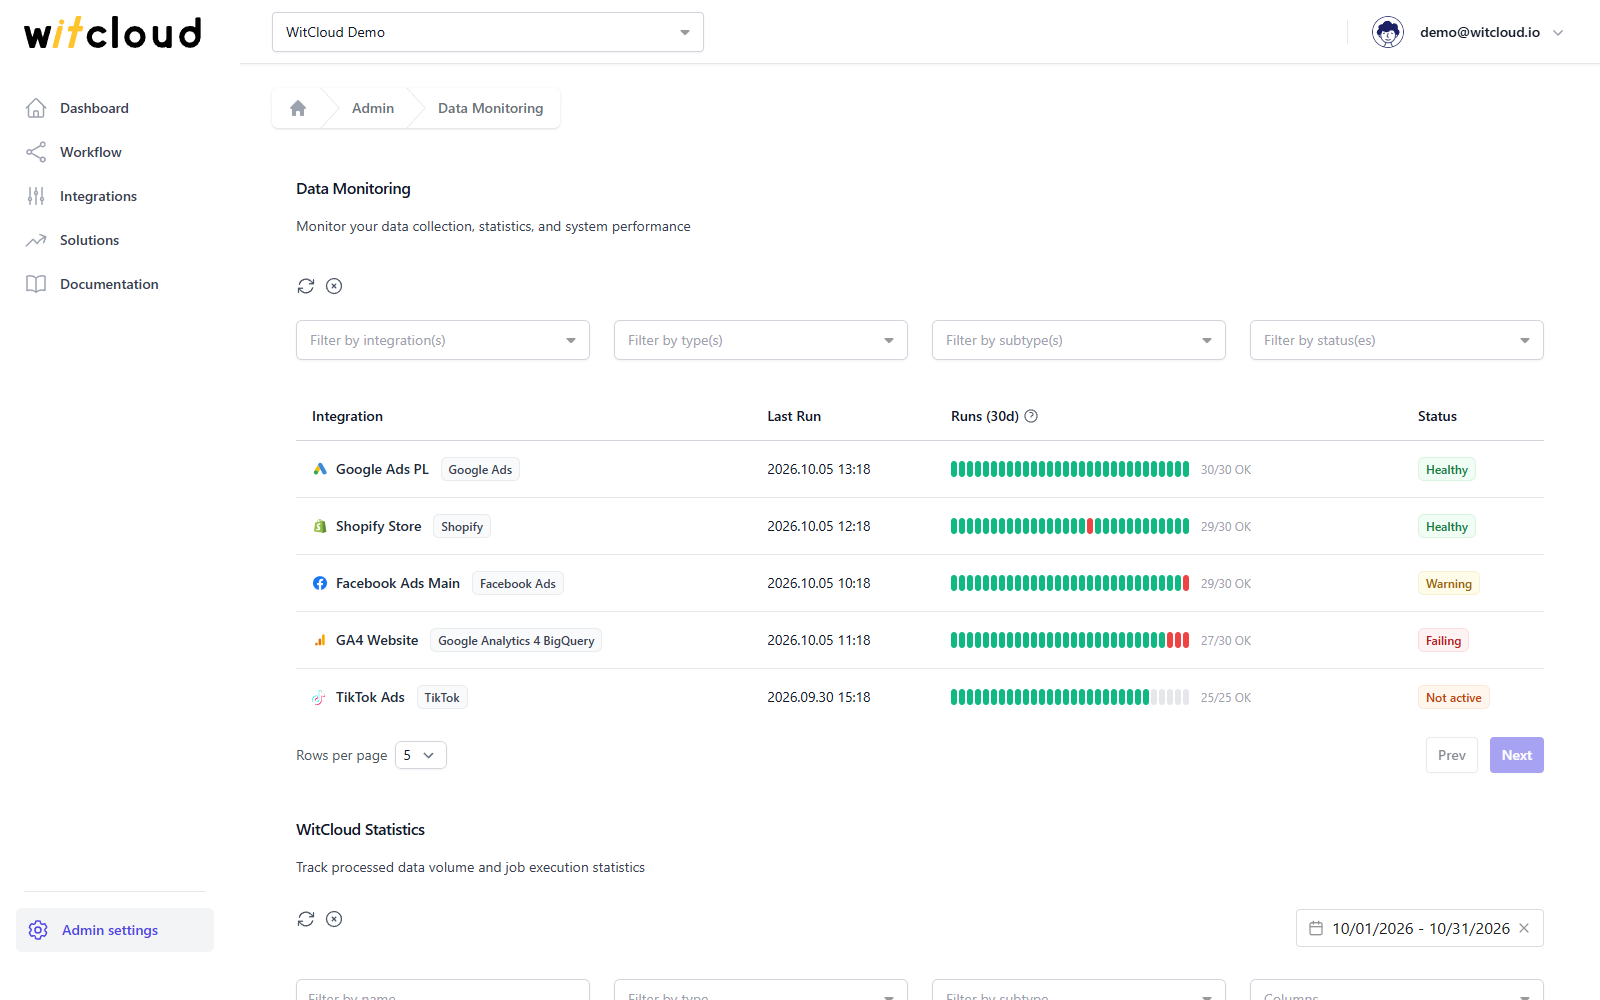
| Status | When |
|---|---|
| Healthy | The integration runs and its runs succeed. A few isolated failures it has recovered from do not change that. |
| Warning | The last run failed, or at least 2 runs and at least 5% of runs in the last 30 days failed. |
| Failing | The last 3 or more runs failed in a row. |
| Not active | The integration has not run for more than 3 days — its workflow may be paused, switched off or removed. |
| No data | The integration has not run in the last 30 days. |
Narrow the list with Filter by integration(s), Filter by type(s), Filter by subtype(s) and Filter by status(es). The refresh icon loads the latest state; the × icon clears the filters.
WitCloud Statistics
WitCloud Statistics shows how much data the project's jobs processed and how many runs there were.
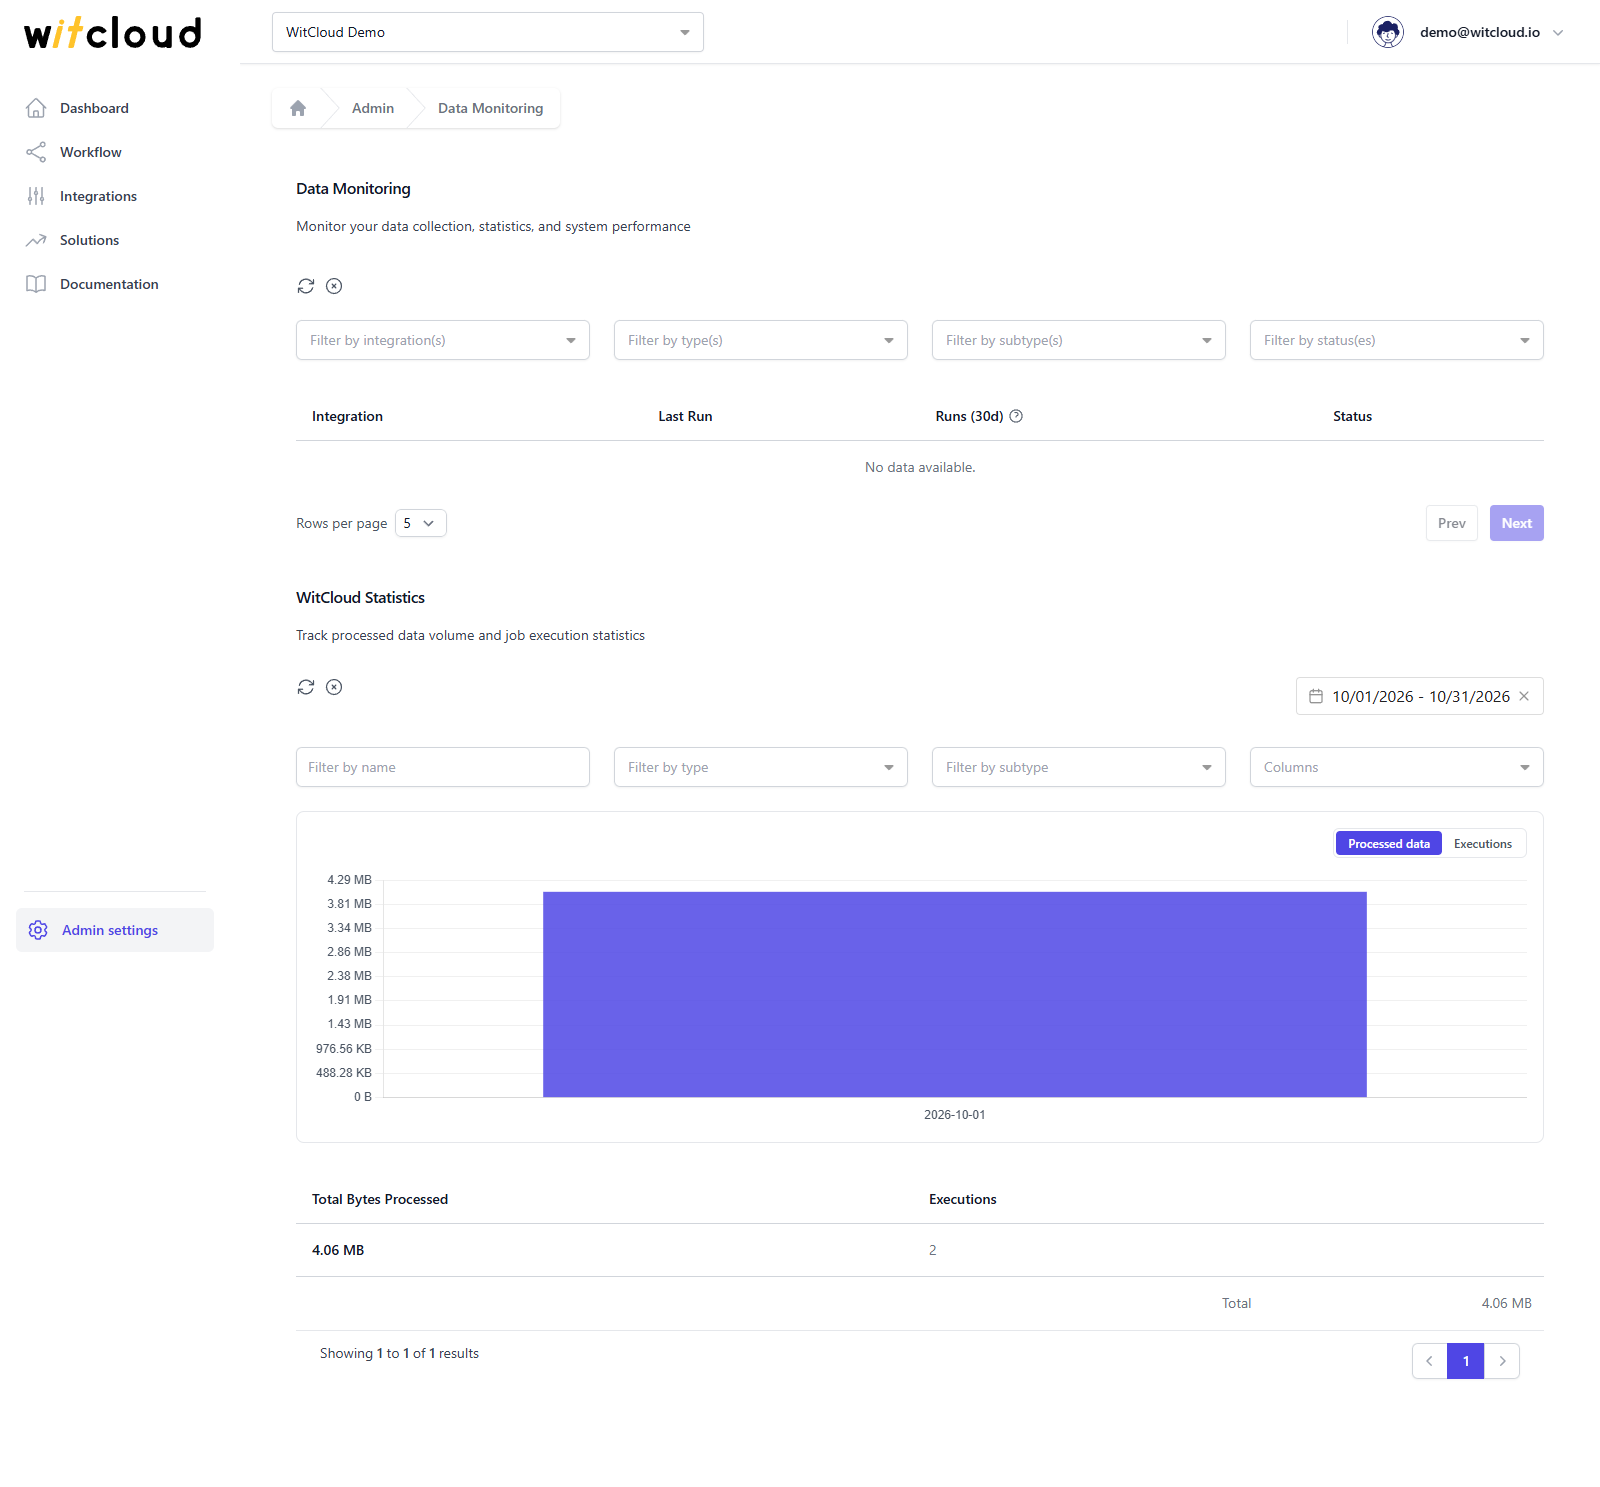
- Pick the period in the date field — the current month by default.
- Use Filter by name, Filter by type and Filter by subtype to narrow the jobs.
- Choose Columns — Date, Month, Name, Type, Subtype — to split the numbers by them. The chart and the table follow the same choice; the chart shows the 20 biggest values and puts the rest together.
- Switch the chart between Processed data and Executions.
- The table has a Total of the processed data for the selection.